There’s another way Australia’s ageing population will ruin our economy that nobody is thinking about

Out of the US National Bureau of Economic research comes a brand new paper by researchers from Stanford University and Beijing University. It’s a triumph of scholarship and it is full of bad news.

The researchers look into entrepreneurship to see the demographic impact. It turns out to be bad news for those countries whose workforce is ageing.

The reason the researchers hypothesise is that younger people don’t get the experience they need to make a business fly. Their inherent capacity to think about problems in a new way is not matched with business skills. The reason for that is that old people are hogging all the senior positions.

“Workers may begin with raw talent and inherent creativity, but the acquisition of skills at work is essential to their founding a business. It is for that reason that the young are not the ones most likely to start businesses, even if they are the most creative. They must have time to obtain the skills on the job that will allow business that they found to succeed.”

Stuck at the bottom of the corporate ladder, it's raining, and the economy is being ruined. This is your life.
Stuck at the bottom of the corporate ladder, it’s raining, and the economy is being ruined. This is your life.

The data support this model of thinking about entrepreneurship:

“The estimates imply that a median age that is one standard deviation lower is associated with a 2.5 percentage point higher country rate of entrepreneurship, which is about 40% of the mean rate. This effect is significant both statistically and economically, and is robust across different specifications, alternative measures of entrepreneurship, and among OECD and non-OECD countries.”

But older people have more business skills and experience. Does that help? Not at all, apparently.

“Within every age group, the entrepreneurship rate is lower in countries that are older.”

Japan is the sine qua non of this theory, with its fertility rate declining towards 1.0 and massive conglomerate companies full of ageing workers.

“[I]n Japan, none of the top 10 high-tech companies were founded in the last 40 years. New firm entry
rate dropped from the 6 to 7% range in the 1960s and 1970s to 3% in the 1990s (Acht, Thunik, and Verheut, 2004), which amounts to less than 1/3 of that in the U.S. and trails all the other OECD countries. “

Potato Drink? Japan, you've stopped even trying.
Potato Drink? Japan, you’ve stopped even trying.

The researchers emphasise the importance of entrepreneurship to economic vitality. New companies tend to do things old ones just can’t.

“Existing companies can modernize and update their products and techniques of production, but the major innovations tend to be associated with entrepreneurship and the formation of new companies.
Many significant inventions of the last 150 years illustrate the point. Thomas Edison invented the light bulb and founded General Electric. The inventor of the automobile was Karl Friedrich Benz, followed closely by Gottlieb Wilhelm Daimler. Daimler-Benz is the product of their inventions. Alexander Graham Bell invented the telephone and founded AT&T. Guglielmo Marconi, the inventor of radio, was a founder of Wireless Telegraph & Signal in Britain. The Wright Brothers founded The Wright Company, which later became Curtiss-Wright. Steven Wosniak, who invented the personal computer, teamed up with Steve Jobs to form Apple. The list goes on.

In Australia, you might cite Kogan and Cochlear, A2 milk and Atlassian.

But to produce a handful of companies that are both new and extremely exciting, you need a steady stream of companies that are new.

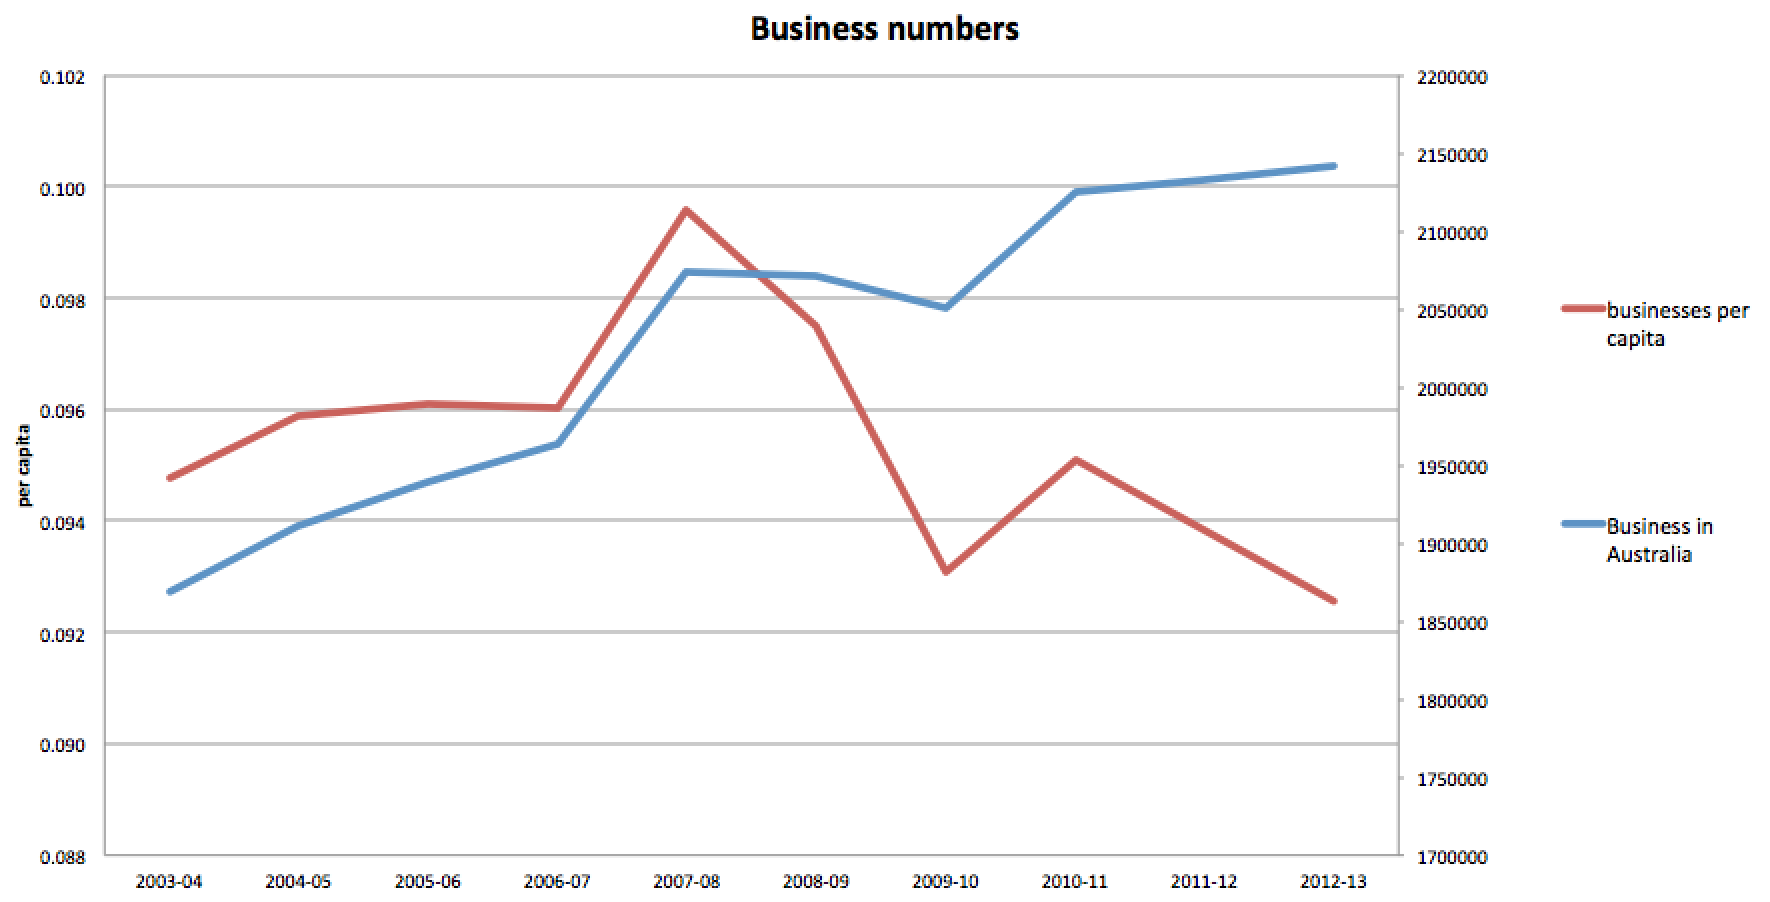
And Australia has been performing worse and worse on that measure.

Decline of business entries


There could be many reasons this has happened. But the data doesn’t refute the theory that demographics should take the blame.

decline of under 40

Everyone already knows the ageing of Australia’s population will create a major labour force shortfall. We’ve all heard that there will be fewer and fewer workers in the economy for every retiree (This article says the ratio will decline from 15:1 in 1909 to 2.6:1 by 2050). Everyone is aware of the fiscal imperatives around ageing. But the possibility that it is crushing the spirit of our economy is not something I’ve heard discussed.

But there is one shining light in the darkness. Not all the variation in entrepeneurship can be explained by ageing. In fact, the most entrepreneurial state in Australia is also one of its oldest: Victoria. The high rates of international migration, high levels of education and the density of the population may all be part of the reason.

If policy-makers want to keep Australia’s economy sharp and firing even as it greys, they should keep a close eye on the state south of the Murray.

US inflation is still low. Is everything we know about macroeconomics wrong?

The US consumer price inflation rate in August was -0.2 per cent. Negative inflation in the month and up just 1.7 per cent in the year. Despite the US Federal Reserve moving heaven and earth to avoid such an outcome.

The Fed has cut interest rates to near zero and done over $3 trillion worth of “quantitative easing” in order to try to lift inflation up into positive territory. That’s “loose” monetary policy where the government pumps money into banks. Their ultimate goal is to get higher inflation to give the economy a boost.

But there is another school of thought. That maybe the reason they’ve failed to cause inflation is that quantitative easing actually causes deflation.

This idea is shocking. When I first saw it getting serious attention, I had to check to make sure I wasn’t on The Onion. Surely QE is an increase in money supply, and so should cause inflation.

The list of governments engaging in QE includes the US, UK, and Japan. If it doesn’t work, then how in holy hell has the global economy not collapsed by now?

Here’s the data since 2000 on inflation in those countries

US inflation
US began QE in late 2008; really ramped up with unlimited QE3 in Sept 2012
Japan INflation
Japan was doing limited QE over a decade ago. It really ramped up its QE in 2013. That recent blip in the chart is mainly due to a rise in GST/VAT, however.
UK Inflation
UK did limited QE in 2009/10 and 2012.

To me, these graphs look ambiguous. If QE causes deflation, how?

There are a few answers floating around, with the most often cited one being this (and it’s slippery):

“Quantitative Easing increases the total amount of money in circulation. That money has to belong to someone. It has to be in someone’s wallet or in some bank’s vault or somehow “held” by some person or institution. With the interest rate stuck at zero the only way that folks are going to agree to this  if the inflation rate goes down. That’s because high rates of inflation make people want to hold less money and more tangible assets. This is what economists call an equilibrium condition.”

– Forbes summarising Stephen Williamson

If the causation in this seems to run a bit backwards, that’s because the logic started off in mathematical identities about the economy, not in a verbal argument. (“the only way folks are going to agree to this” seems to be the verbal version of taking a variable from one equation and substituting it into another).

It depends on something called the “liquidity premium” which has to do with how much compensation people want to hold their assets in cash. To me, the causation runs the other way. You control your cash holdings, not the inflation rate. The idea agents can hold down the inflation rate just because they currently have a lot of cash seems silly.

But my belief in mathematical economic proofs is at the zero lower bound anyway, and you can’t argue too hard with the data (at least until you make a fail-safe counterfactual generator).  Some sensible people are giving this idea credence, others not.

The idea that QE causes deflation is controversial. But the idea that it does not do much to lift inflation is more widely accepted. And that makes some people angry, because QE is not exactly costless.

One side effect is lifting the amount of assets the US Fed holds. It doesn’t just give out the cash under QE. It swaps cash for assets. So now the Fed owns a lot of “mortgage backed securities” – the same things that sparked the GFC – and that has some people arguing its solvency is at risk.

Another side effect is exchange rates. US quantitative easing can shoulder the blame for the high Aussie dollar over the last few years. That killed a lot of Australian businesses.

The last side effect is a big rush on assets. All this loose money has pushed up asset price worldwide. The return on a 10-year Portuguese government bond has fallen to a comically low 3 per cent, from over 15 per cent. (Returns are the inverse of price).

Portuguese bonds


Australian house prices have seen inflation too, although not to the same extent. These trends have the Bank of International Settlements – the central banks’ central bank – in a flap:

“By fostering risk-taking and the search for yield, accommodative monetary policies thus continued to contribute to an environment of elevated asset price valuations and exceptionally subdued volatility.”

But the US QE program is finally coming to an end in October. The program which once added $85 billion a month in liquidity to the global economy is nearly at an end. It seems doubtful we will get a clear picture of what the effect was on inflation from this one program.

We may need many more iterations of financial crisis and government response to figure it out, and that may be just what we are going to get.

The distinction between work and leisure is just a model. And it’s breaking down

Economists like to divide up our lives into work and leisure. Like a lot of economics thinking, this is just a model. It compresses some details to make issues tractable. Which is normally fine.

But this model is very powerful – it is very widely accepted, and used outside the profession. The average punter is able to say, well, the cost of pizza delivery is $4, and it would take me 15 minutes to go to the shop and back, so I should get the delivery if I value my time over $16/hour. Since I make $20 an hour, I’ll get the delivery.

If this labour/leisure model fails, a lot of our thinking about the labour market needs a re-think. And this model fails in many ways.

Continue reading The distinction between work and leisure is just a model. And it’s breaking down

Selling the street: A land use hypothetical…

If you were given the option, would you do this?

Sell off the street in front of your house for development, leaving only walking access.

Google maps draws streets as thin little lines, but they can be wide, sometimes half as wide as the blocks are deep
Streets – outlined in red – take up about 30 per cent of this area in the backstreets of Collingwood.

Google maps draws streets as thin little lines, but that is misleading. They can be wide, sometimes more than half as wide as the blocks are deep. Is dedicating so much land to traffic really wise? Especially where you have dead-ends, those streets are minimally used. The last 20 metres of a cul-de-sac might see only 10 car trips a day. To me, that seems wasteful.

Selling off your street would be unacceptable in a scenario where house prices were low. But Australia’s house prices are high. It makes sense to use land for its most valuable purpose.

The land in front of my house and the neighbours (which is also, of course, in front of our neighbours opposite), might be worth $500,000. If the decision to sell it off meant a windfall of $125,000 for all four parties, all parties might be tempted.

The way to make this work would be to build a parking structure within a reasonable distance. The land at the end of the street, nearest to the main road, would be a logical place for that.

Redevelopment of Keele St
Yellow squares would be new lots for development, black area at left is new parking area

This hypothetical might seem odd. It’s not standard to think of suburban streets as optional. But we should ask why they are compulsory.

Walkable laneways for access are part of some very desirable housing options, including big resorts and hotels, big apartment developments, and whole cities, including this car-free city in China, the “old towns” of many cities of Europe, and of course, this little place in Italy.

Gondola parking, however, is a bitch
Venice

Meanwhile, Los Angeles CBD is 24 per cent streets and 25 per cent parking, according to one analysis.

So what’s optimal?

This blogger has a fantastic post on the topic of area given over to streets. He emphasises that it is highly variable by neighbourhood.

Street dominance is not a given, it's a variable. That means it should be subject to debate
Street dominance is not a given, it’s a variable. That means it can be up for debate.

I was inspired to think about whether we really need all our suburban streets after reading about road pricing in a recent speech by the head of the Productivity Commission.

There are already tolls on some of our most popular roads. But the vast majority of roads (by length and by area under tarmac) are side streets. Attempting full cost recovery for these would be very expensive for the people who use them.

If my street cost $10 million to build and requires a return of 7 per cent, the locals must generate $700,000 a year in revenue. If there are 50 car trips a day ( a car every 20 minutes in the 16 waking hours), those trips will be charged at $38 each. Ouch.

You might not sell off the land in front of your house when the alternative is a lovely street you get to use free of charge. But if that street were tolled, the combined carrot and stick might change your mind fast.

If you lived on a main road, obviously it would not be in the public interest for the land in front of your house to be sold. But equally, the number of people using that road would be much higher, so the toll would be a lot lower and the “stick” part of the equation less compelling.

Obviously there would be massive coordination problems and equity challenges associated with such a plan. Selling off the road at both ends of the street would pretty much force the people in the middle to do the same. And if someone with major mobility problems lived on your street it might be unfair. This hypothetical question will remain hypothetical for a very long time.

But the fundamental issue here is not unlike the question of burying rail lines, providing surface parking, or putting roads in tunnels. What is the most valuable use of our scarce city land, and how much are we relying on legacy structures to determine those uses?

“Burn it down, start again.” Why a big fire might actually be good urban policy.

“The Fire itself is not a policy proposal,” the researchers write. But that little caveat only comes after they list all the virtues of conflagration, and you get the feeling they threw it in as an afterthought.

This weird and wonderful paper tries to explain an economic puzzle that followed a fire that consumed nearly 800 buildings in the downtown of one of America’s most important cities. The Great Boston Fire of 1872.

“The striking initial result is that land values increased immediately in the burned area, relative to the unburned area.”

Not just building values, but land values. In addition, building values rose as owners replaced the old buildings with better ones.

“Building values increased substantially in the burned area, following reconstruction, and converged over time..”

They confirmed their data by comparing to other smaller fires.

“The great extent of the Fire appears central to its impacts, … Building values increased following single building fires, but building values increased by more following the Great Fire. Further, while land values increased following the Great Fire, burned plots’ land values were unchanged following an individual building fire.”

The theory is that the structure of the city changed in some important way. That each individual building had spill-over effects, or externalities, that were turned from a mix of positive and negative, to mainly positive.

“The Fire’s impacts are indicative of substantial inefficiencies in even wealthy urban areas. Indeed, the implied magnitude of inefficiencies is even larger because even widespread reconstruction after the Fire is not predicted to obtain first-best land-use in the presence of neighborhood externalities.”

The theory that new buildings have positive spill-over effects looks good, because land values also increased in area adjacent to the fire, that were not actually burned.

Land values by distance from fire

They rule out a couple of other explanations:

  • Increased agglomeration. It seems industries didn’t move.
  • Improved infrastructure. The pipes weren’t damaged and didn’t get replaced and plans to improve and change the road network (other than some widening) met with opposition

So what’s the point of this research? I don’t know of too many cities where the advice to knock it down and start again might really take root. (Perhaps Sydney?)

The list of cities that have been knocked over and started again is a list of powerful cities. London had its great fire in 1666. San Francisco had its big earthquake in 1906, which destroyed 80 per cent of the city.  Napier had a big quake in 1931 and turned its bad luck into an art deco renaissance.

The research is relevant to the residents of Christchuch, still in recovery mode after their 2010 quake. The message might be: don’t move away just yet, this all could work out, economically speaking.

It also suggests good results well for urban infill in less-favoured parts of the city. Buying the lots next door to a big new development could be a smart investment.

“Tearing up the contracts” for the road tunnel means there is an actual difference between the political parties. Wow!

The state opposition here in Victoria has just announced it will cancel the contracts for an $8 billion tunnel if it wins the election in November. (While it’s true there’s often a big traffic jam on the road in question, the tunnel fails both cost-benefit analysis and any assessment of what sort of infrastructure the city will need in the future).

THE POLITICS

Deciding to cancel the contract is a bold call, and I suspect, the result of intensive polling. Of course, the government saw this coming, and has a strong line of attack running, calling opposition leader Daniel Andrews an economic “vandal.”

In pledging to cancel the contract, Andrews leaves open the question of what he might do instead, and he doesn’t seem to have much of an answer.

Of course Labor doesn’t want to make new giant policy pledges, before the election. The end of the road project would mean, however, that some money becomes free.


Labor still has as part of its election platform the construction of a major rail tunnel – “Melbourne Metro”. Both parties are pretending these two mega-projects are not alternatives, with the coalition government pretending to progress the rail project alongside its favourite road. But realistically, the expense and trouble means the projects are an either/or. Cancelling the road contract is an essential input to building the rail project, it’s just that Labor can’t really admit it.

Assuming the “vandal, Naysayer” tags don’t stick, and the lack of a clearly defined alternative doesn’t hurt Andrews much, I think this is smart politics. Voters like a clear choice and the sniff of real leadership.

The seats that would benefit from the tunnel are mainly Liberal strongholds, and I think if Labor focuses on talking about health and education for the rest of the campaign (and especially if Tony Abbott pops his head up) Labor will win the election.

THE ECONOMICS

Promising to tear up the contracts, before they’ve been signed, is a big risk on the part of Labor. I can imagine Lend Lease and the infrastructure minister sitting in a room right now, amending the cancellation provisions. $100 million? Why not $500 million? Protecting the project and/or hamstringing Labor could both be achieved in the stroke of a pen.

We rely on their good citizenship not to do so. A flimsy protection indeed.

Of course there should be some cancellation provision. A lot of money has already been spent on this project. But from an economy-wide perspective those are sunk costs and we ought to ignore them.

The companies that are selected to build the tunnels will seek sympathy. They will talk a lot about all the investments they have made – hiring people, doing mapping, buying diggers, etc. But we should not listen too closely:

  1. Until just this week there were two bidders in the running for the project. Each of them faced a chance of missing out even if the project went ahead.
  2. The prospect of the project being cancelled was obvious. I bet they haven’t actually made a dedicated unilateral investment in this project for months. Anything they have bought will probably be able to be sold or moved to other projects.
  3. Generous contract cancellation provisions arguably makes this money for jam. When you start building a project, there’s risk of making a loss. When it gets cancelled before you begin, any compensation is pure profit.

The real impact of this cancellation will be felt in future projects. Political parties will have similar incentives to infrastructure companies. Both have incentives to prevent the opposition cancelling the contracts.

If Lend Lease offers Labor a contract for the rail tunnel that includes a slightly lower total cost but enormous contract cancellation provisions, Labor will leap at the chance to protect their project from the whims of future administrations.

There’s game theory at work, and this might be the last chance we have to cost-effectively vote out a project of this kind.

Can we make Australians WANT a land tax?

If tax reform is boring, that’s because it’s run by boring people. Economists can spend hours sitting round teasing out the intricacies of an allocative efficiency improvement.

But when it comes to convincing others, economists tend to stroke their moustaches, repeat the word “productivity” and wave their laser pointers at a dense thicket of lines on a graph.

We need some marketing type thinking to help us economists. There is no other way the Australian public can be swiftly convinced of the merits of new taxes. And convinced they must be, because the economy needs all the productivity gains it can get to lift incomes.

Land tax is the best tax. Everyone who understands economics knows it. It’s minimally distortionary.

“Well-structured taxes on land … are a highly efficient means of raising revenue.” [Henry Tax Review]


“… raising the percentage of tax that falls on the unimproved value of land has few distortionary or adverse affects…” [Macrobusiness]


“We argue that there is a compelling case for the abolition of stamp duties and their replacement by a broad-based land tax” [Australian Housing and Urban Research Institute]

But people really hate the idea of taxing land, and whipping up a scare campaign could scarcely be easier.

“Call For Tax on Family Home.” [Headline in the West Australian]


“People will be paying between 20 to 40 per cent more in land tax. The bill will also diminish Queensland’s ability to attract interstate and overseas investment which will ultimately flow through to impact employment” [Property Council of Australia, cited in the Australian]

We need to change people’s beliefs about taxes. But more than that: we need to change people’s feelings about taxes.

At the moment, land tax is wildly unpopular, while the luxury car tax is wildly popular. I theorise that people like the idea of a tax they can avoid, hate the idea of a tax they can’t avoid.

So how do we change people’s feelings about unavoidable taxes? Do we lecture them about deadweight loss and distortion?

deadweight loss

I can feel the eyes glazing over already.

We need something far punchier, something that fires the emotions. Something a little bit like this…

The ad starts with the bespectacled taxman knocking on the door of a large mansion. “Tax time!” he cheerfully announces.

The door is answered by a butler, before a rotund, pinstriped individual arrives and pulls his pockets inside out. His face affects an attempt at sorrow that barely conceals a smirk.

The taxman’s brow furrows in disgust and we zoom out to see him walking back down the long gravel driveway, past an array of parked supercars.

Cut to an exterior shot of a big city accounting company. The voiceover intones: “They can hide income. They can hide capital gains. They can even hide the companies they own. But they can’t hide land. Land tax now for a fairer Australia.”

I’ve discussed this kind of idea before, with a “Trevors in Traffic” campaign to promote congestion charging. The point is that you can’t start arguing for a solution when people don’t even understand there is a problem.

“I remember reading about a behaviour change campaign to get kids to wash their hands. Rather than starting with facts about soap, they started with an ad that dramatised germ transfer. Everything the main character touched after leaving the bathroom turned green. Understanding the problem (even in a stylised way) came first.”

Teaching people about the allocative efficiency of various taxes is going to be expensive. You’d need TV ads, newspaper ads, a PR blitz. But if it greases the wheels of tax reform, it could be the best money ever spent in the Australian economy.

My HECS debt is finally gone!

In 2004, I attended my last exam at the University of Melbourne – 316-303 Industrial Economics. As the “pens down” call went out, quiet fell. The ratcheting sound of my HECS debt accruing was finally gone.

The day I graduated, that debt was around $30,000.

I went on to add a bunch of credit card debt that final summer of freedom, flitting around the northern hemisphere in the knowledge that I had a job waiting for me in Canberra when I came back.

santa 2004
Christmas 2004. I had to shave when I came back home.

But while that $6000 of credit card debt was paid off within six months of working full time, the $32,000 took 10 years of nibbling to finally destroy.

HECS is a system that allows you to buy education now and pay later. You rack up debt on every subject you study (arts costs less, medicine more). Then you only have to pay it back once your earnings go over a certain level, currently $51,309.

HECS was invented by a kindly gentleman called Bruce. I’ve met him and he seems like a good egg.

The idea is for people who get a big benefit out of their tertiary education to put some money back into the system to help keep it afloat. The genius of HECS is that it – in theory – shouldn’t deter people who come from less wealthy backgrounds, or have lower expectations of their lifetime earnings. If they never earn above the threshold, they never pay it back.

My HECS debt shrank steadily for several years, then picked up again in 2008 when I left the federal government to sample a life of leisure, etc. The knowledge that the HECS debt you worked hard to eliminate is creeping back up does tend to haunt those otherwise blissful idle hours. Perhaps that’s the point. But the good news is it only ever goes up at the rate of inflation.

So long as wage growth outstrips inflation, your HECS debt is getting smaller in practical terms.

Wage growth vs inflation

There were always deals available where you could trade cash now to eliminate your HECS debt with a small bonus. But I never took them, preferring current liquidity and betting that my future wages would make my HECS debt seem small. (After choosing to work in media, I never really reached that point.)

By the end, the impact of HECS on my paycheque was quite annoying. I would much have preferred the few hundred extra in my hand every time. But then, while I wasn’t paying attention, it was gone. Hallelujah!

The lessons of HECS are this:

  • When the government adds a few percent to your fortnightly tax bill, you mostly don’t notice.
  • Income contingent loans seem like a very fair kind of user-pays. We should use them for other things. For example, sports.
  • The zero real interest loans are really nice. If it weren’t for them, I’d be up to my eyeballs in debt still, like some New Zealanders I know. Education Minister Christopher Pyne wants to introduce positive real interest rates. I think that could be justified only if you ignore (or don’t care about) the deterrent effect. Students with less access to economic resources are already far less able to attend university, and the prospect of enormous mounting debts will only make the challenges worse.

Grattan SES uni

A fact you never guessed about our 21st century, hyper-speed labour market.

We live in a new era. A time unprecedented. An age where the economy shifts as fast as you can send ones and noughts along optical fibre, and the job you’ll have in five years time hasn’t even been invented yet. Right?

Not right.

My favourite labour economist is Jeff Borland, and he specialises in truth bombs, which he distributes in his monthly labour market snapshots. I’ve written them up before, for example, here.

He crunched the numbers and found that despite the decline of unions, the march of neo-conservatism, the lingering influence of Peter Reith and the legacy of workchoices, job durations are as long as – or longer than – they were in 1982.

Screen Shot 2014-09-08 at 11.55.04 am Screen Shot 2014-09-08 at 11.54.57 am

Borland:

“If I had a dollar for every time I have heard that: ‘Young people entering the labour market today are going to have many more jobs during the course of their working lives than older generations’, I might not be rich, but I reckon I would be owed about a thousand dollars.”

For the last dozen years (at least), he’s been a professor of Economics at Melbourne University, so he knows tenure. In that time I’ve had probably ten jobs, so this news is very surprising to me.

What else is interesting is that people feel (and are) relatively safe in their jobs.

Screen Shot 2014-09-08 at 11.59.47 am

I suspect they feel even safer since the Abbott government started polling about as well as the Gillard goverment. The chances of frightening workplace reform coming out before the next election would have to be slim to nil given the reputation of the government right now.

Who thinks the ice-bucket challenge is over?

Is the ice-bucket challenge over? Done and dusted? Even boring?

Geometric progression – each soaked individual challenging three others – meant it spread from celebrities like Bill Gates, to people like me within just days.

I strongly recommend opening this map to look at how fast something can spread when it goes viral. That explains why every man and his dog is doing the challenge in your facebook feed.

The history of the ice-bucket challenge is surprisingly deep.[source] Over a year ago a “cold water challenge” was getting limited traction on social media in America, related to charitable donation in general. It was low-visibility for a long time.

Then in June 2014, at the start of US summer, it somehow morphed into an “ice-bucket challenge” and first got into mainstream media via a golf channel.

In mid-July, golfer Greg Norman challenged an NBC TV anchor who completed the challenge. At around the same time, another golfer tied the ice-bucket challenge to ALS, a disease which kills nerves in charge of movement in the brain and spine. The rest is history.

There is a lot of dispute about the “rules” of the challenge. Do you tip the water on your head AND donate? Or are they alternatives?

This ambiguity seems to actually help. Some can afford to donate a lot, others only a little, but everyone can to play the game. That helps it move forward.

But this is more than just another viral trend, like cat batmans.cat batman

The gold at the heart of the ice-bucket challenge is making middle-class philanthropy public.

Australians gave on average $64 last year, according to research by NAB. But mostly, you don’t hear about it.

giving per capita

Perhaps if you dig into someone’s Movember page you can see who is generous. If you do a charity fun run you know who digs deep. But mainly, giving by average middle-class people is anonymous. 

This is despite that fact it is established that social pressure encourages donations. Is it a coincidence that the very wealthy give a lot and they give in public? The Shane Warne Foundation. The Sidney Myer Fund. That gets them kudos on top of tax deductions. And it stands to reason that the bigger the benefit, the bigger the donation. That’s basic incentive theory.

The ice-bucket challenge’s charm is this: you no longer need to provide enough funds to build a new library at your alma mater to be able to be recognised for your philanthropy. If you’re especially high-minded this might seem tacky, but you can’t deny it. People want something in return when they give. Social media stardom and recognition, it turns out, is enough.

This is actually a really good thing.

Even if you have begun to find the ice-bucket challenge boring, and think “donating for likes” is crass, you can’t deny that seeking likes for donating is better than seeking likes for a tropical poolside recline, or for a photo of some toast that looks like David Beckham.

Young people (25-34) donate least to charity, averaging just over half as much as the 65+ bracket each year. Things like the ice-bucket challenge can change this. And activating the great mass of people to donate makes more sense than chasing a few rich donors. Average middle class people give the most as a proportion of their income:

giving by postcode
Mosman, Balmain and Vaucluse top the list in dollar terms, but not percentage terms.

Right now, in the board rooms of charities world-wide, they are trying to figure out ways to replicate the success of ALS, with a similarly viral campaign. (If I was advising a charity, I’d suggest something involving cats. The internet loves cats.)

The charity sector will have failed if they do not capture the current public enthusiasm for low-level philanthropy. Expect to be challenged to donate to something else very soon!

Where in Australia should you buy a house?

The RBA kept official interest rates on hold again today at the record low of 2.5 per cent, while actual mortgage rates are low and falling:

Source RBA

So could house prices actually rise from here? One economist whose blog I read has built a buy/sell indicator. It’s currently on buy.

He reckons house prices will keep going up while the mortgage rate is not much more than the rental yield. He also theorises that Sydney prices rise first, and the rest of the country lifts thereafter. This theory holds water for me on an intuitive level. In the short run, a house in Melbourne is not a good subtitute for a house in Sydney, but in the medium term, perhaps it is. In the long-term, perhaps even a house in Adelaide could be a substitute!

But house prices in Melbourne seem a bit high to be making bold acquisitions for speculative purposes.

Luckily, house prices are very different across Australia. Sydney is way out in front. Perth, Melbourne and Canberra are a cluster. Then Brisbane and Adelaide are limping along at the back of the pack. Hobart doesn’t make the graph but it is somewhere back there too. 

House prices across australia

If you wanted to buy a house somewhere cheap, which makes most sense?

You’d want to choose a place with strong growth prospects. In recent times, all three laggards (Brisbane, Adelaide, Tassie) have shown a bit of pluck when it comes to the labour market (focus on the yellow lines).

QLD job adsSA job ads

Tassie job adsBut you want to be careful. Tasmania’s prospects are pretty dire, as discussed in this piece: How long until Tasmania is totally empty?

So which city are people most likely to move to?

Moving to ...
Google Trends says Go North!

The Brisbane connection looks to be the smartest option. Hmm, how much is one of those famous Queenslanders (a wooden house on stilts)?

Turns out you could get one in a great inner-city suburb for $610,000,

Queenslander

(or a perfectly adequate seeming flat in the inner city for $190,000.)

Now, despite its “beautiful one day perfect the next” weather, Brisbane doesn’t rate a mention in the top ten cities ranked by the Economist for liveability.

Melbourne scoops that award every year (Adelaide came 5th this year in results released today). But while we are being open-minded, it’s worth noting that that survey is horribly biased.

If we broaden our horizons we find that Brisbane makes the top 25 list for the much hipper Monocle Magazine quality of life ranking, getting a shout out for its excellent Gallery of Modern Art.

Is that enough to make you want to purchase your own place in the sun? 

To have and to hold (a job). The correlation of marriage and employment is puzzlingly strong.

You’d think getting married is relevant to your home life. You wouldn’t expect it to change your employment outcomes.

I mean, I’ve never done it, but I doubt you get back from your honeymoon buzzing with a desire to read and reply to all those emails.

And yet, the correlation between marriage and labour market outcomes is quite astounding. 

Unemployment

The unemployment rate for unmarried men is nearly four times higher than for married men (11.3% vs 3.1 per cent). For women, the ratio is over two (8.9% vs 4%).

The difference between married and unmarried makes the difference between men and women look small. 

Essentially, if you are a married man, you’re living in a labour market no different from the best parts of the 1970s, with 3 per cent unemployment!

Might this be a statistical artefact? It could come about because the young have poor employment outcomes, and are less to be married. Let’s have a look at an older age bracket.

Unemployment 35-44

The absolute levels of unemployment have fallen, especially for men. But the ratios of unemployment rates between married and unmarried are about the same: 4:1 for men and 2:1 for women.

The above graphs make it look like married people are all hard at work in the office. But the unemployment rate hides a big difference in participation rates.

There are two distinct clumps in this chart. Married men, who participate in the workforce at a rate of 95 per cent. And everyone else, who participate at around 75 per cent.

participation

The 80s were a time of rapid change for women. But since 1990, one of the biggest changes in the employment market has been unmarried men dropping out of the labour force. Their non-participation rate basically doubled from 10 per cent to 20 percent.

Given the unemployment graphs on the previous page, I’d be very surprised if the red line (married women) didn’t tick up over the green line in coming years.

Two mysteries remain.

1. Why is the difference between the married and unmarried so strong, and so consistent over time?

I have a few theories.

Perhaps the unemployed are busy proposing, but are rejected because they are unemployed?

Perhaps there are confounding variables, like good looks or intelligence, which are correlated with both earning power and marriageability.

Perhaps it’s not about the kind of people they are but the incentives they face:

Obviously marriage and children are correlated. Obviously children (who are cruelly forbidden by the law to earn the money to feed themselves) are expensive. Could it simply be the compulsion to put bread on the table that explains why married people are so rarely out of work?

2. Why is the labour force participation rate of unmarried men eroding?

Marriage is increasingly rare, and increasingly for the old.

Can that explain the fall in unmarried men’s attachment to the labour force?

Screen Shot 2014-08-15 at 10.54.35 am

Screen Shot 2014-08-15 at 11.02.39 am(They are also increasingly likely to have a non-religious ceremony, but I’m not sure that’s relevant)

celebrant


I’m not sure it does, and this makes me wonder if perhaps the “discouraged worker effect” might be true. All those unmarried men might once have worked in factories. Maybe they’re less able or inclined to take service sector jobs. 

There might also be an echo of higher immigration rates in the data. The overseas born have lower workforce participation rates. (chart source)

immi


Which looks like a nice simple story, until you fold it back in on itself and see that immigrants actually get married at a higher rate than their proportion in the population! (Number of marriages is on the vertical axis, so in total, this graph shows that at least 40 per cent of people getting married in Australia are overseas-born.)

marriage of immigrants


How focusing on “trend” unemployment figures is like chanting “scoreboard” at the football.

Today’s unemployment figures were SHOCKING: the unemployment rate shot up to 6.4 per cent, a whopping increase from last month’s result of 6.0 per cent, in seasonally adjusted terms.

Except.

There are two main series that report the unemployment rate. Trend and Seasonally Adjusted. The former is more stable, the latter is more variable,.

There is a constant fight online between two gangs, the “wonks” and the “journos”. The former generally think the latter are too sensational with their taste for the more wildly variable series.

bloods_crips_
Wonkz v Press.

Here’s the latest update on the two series:

unemp july

Trend looks like a sensible person who never gets too carried away, while seasonally adjusted is a wild ball of emotions, one moment in the dumps, the next elated.

It’s obvious which one serious-minded people should prefer, right?

But what if I told you trend is faking it? See how it claims to be sloping up all year? Let’s go back in time and consider the countenance of our “friend” the trend back in April.

unemp apr

At the time, it also claimed to be feeling glum. Now it has changed its tune. Trend is like a talented politician, flip-flopping around to try to claim the middle ground and seem more reasonable than the rest.

unemp may

As recently as May, trend was headed downward. Then in June it made a small concession to the last two months of movement in the seasonally adjusted series:unemp juneBelow is how the trend is figured out. Essentially it uses a combination of old and new data to get a sense of how the series is moving over a longer time period.

“The smoothing of seasonally adjusted series to produce ‘trend’ series reduces the impact of the irregular component of the seasonally adjusted series. These trend estimates are derived by applying a 13-term Henderson-weighted moving average to all months except the last six. The last six monthly trend estimates are obtained by applying surrogates of the Henderson average to the seasonally adjusted series. Trend estimates are used to analyse the underlying behaviour of a series over time.

 While this smoothing technique enables estimates to be produced for the latest month, it does result in revisions in addition to those caused by the revision of seasonally adjusted estimates. Generally, revisions due to the use of surrogates of the Henderson average become smaller, and after three months have a negligible impact on the series.”

When wonks say “the trend is your friend” they are focusing on a more than just the latest month’s data.

It’s like at the footy. One side kicks a goal and cheers. The other side points to the score, and chants “Scoreboard!” But in doing so, you can miss an important turning point.

Seasonally adjusted data look at what’s happened in the last month alone, just like the goal that just got kicked is the best measure of the passage of play that preceded it. Because it uses less data, it can also include more statistical noise.

The scoreboard, like the trend series, shows more than that and exhibits less statistical noise.

But this is a game that never ends. If you want to know what’s happening, focusing on the most recent figures seems perfectly fair to me.

Are on-the-spot fines a good idea for public transport?

The government is proposing to bring in lower, on-the-spot fines for public transport ticket infringements, worth $75. Online, people are questioning exactly why the government can arrange mobile payment for fines on trams, but not for tickets.

I want to ignore that for the moment, and ask whether this regime is really smarter.

The fundamental economics of fare evasion fines is simple. There are two factors. A probability of getting caught, and a size of punishment.

If the product of the two is less than the cost of the ticket, you can’t expect people to buy tickets.

For example: the fine is $20 and the inspector is on 10% of trams and trains, you are better off paying $2 on every tenth tram ride than $3.58 for a ticket.

Do you increase the chance of getting caught or the fine?

Ticket inspectors are expensive. They are humans with sick kids and compo claims and they demand superannuation etc, etc. You don’t want to pay too many so the simple model is to make the fine very high.

Your chance of getting caught may be 5 per cent, but because the fine is $220, you are better off buying a ticket. That keeps costs down and encourages compliance.

Fines deterrent effect

The table covers chances of getting caught between 1% and 33%, and fines from $5 to $235. The red areas are combinations of fines and chances of detection at which it doesn’t make sense to pay $3.58 for a 2-hour zone 1 full-fare ticket.

My concern is that if they are reducing fines from $220 to $75, it means they should be planning to have four times as many inspections to get the same deterrent effect. That means four times as many authorised officers on the public payroll. And I hate those guys.

myki shot

But maybe, something different is going on. Could there be a behavioural economics aspect to this?

Humans exhibit present bias [discussed here].

“A leading example of a behavioral bias that impedes market efficiency is present bias, or the tendency of individuals to place much less weight on the future relative to the present than would be predicted by standard models of time discounting. Present bias can lead individuals to make decisions today that reduce future welfare in ways that individuals will later regret (Strotz 1955, Laibson 1997). Analogous to an externality, the situation in which an individual’s decision in the moment creates negative future consequences is sometimes referred to as an internality. Present bias is posited as an explanation for behaviors ranging from a failure to save to smoking.” 

Could it be that a percentage of fare evasion is committed by actual Melburnians who don’t care about the fine because it’s coming in the mail, sometime in the future?

Certainly a share of fare evasion is committed by people who don’t care about the fine because they’ll be back in Gotenburg/Seoul/Lyon by then!

If you bring forward the fine to RIGHT NOW, you might be able to reduce the present bias that says fare evasion is okay.

But costs are not the only relevant aspect. Could on-the-spot fines also manage the human tendency to imagine future effort is easy? “I’ll fight that fine in the court!” I told myself when i was last fined, about a decade ago.

In the end I did not fight it. I just paid it. The writing of the ticket and all the associated palaver in the current system allows one to imagine that the fine is avoidable, somehow. An immediate fine would avoid that. 

For the behavioural effect of on-the-spot fines to work best, Cash would be optimal, but the authorised officers will accept only eftpos.

Of course the minute you allow ticket inspectors to accept cash for fines, there will be some that stop issuing receipts and their reputation will become even worse.

Tell me what you think about on-the-spot fines? Will they work? Would you fare evade more under this regime? Is this all just about saving administrative work in the back end of the Department of Justice? I’m keen to see your views in the comment field below!

When did it become compulsory to wear technical leggings to go for a jog?

I can barely remember the last time I saw a jogger’s legs. Just about anyone who goes jogging has fancy leggings made of “technical material.”

runners

They can cost as much as a flight to Sydney:

Skins

People are prepared to pay a giant amount for goods and services related to sports. Willingness to pay for compression leggings is enormous – never mind that the marathoners at the Olympics don’t wear them, and neither do the 100 metre runners.

The business model of companies like Skins (or Lululemon, Nike, Lorna Jane) is to align yourself with something that is or could be cheap, but which people find highly enjoyable or important.

People can run in cheap clothes, but they love running so much that if expensive and specific clothes seem to be required, the expense is minor compared to the overall enjoyment.

Hanging out with your friends can also be cheap or free. But if a cultural expectation develops that it’s only appropriate to hang out in a bar or a restaurant – not in a park or on a street corner – then people don’t blink to pay.

Businesses that sell expensive bicycles profit because they leverage both these trends. If you want to do that exercise properly, and hang out with your cycling friends, you need to have a bike that won’t embarrass you or leave you lagging behind the bunch. Or so they say.

The business model is this. Find something people love to do. Something that offers them a strong benefit at a relatively low price, and great “consumer surplus.”

cs

Then position your product as an indispensable tool to doing that. It doesn’t matter if your product is truly important – you can capture some of that consumer surplus if you can convince people it is. It might be as simple as making the stitching on your leggings high-contrast to create the impression of science.

This will work best if the activity is undertaken in public. When it comes to public consumption goods like shoes and cars, we tend to be driven by what others are doing, while we may make our own judgments about buying goods consumed privately like electricity providers and detergent. (This terrific paper ranks goods by their conspicuousness, which runs from cigarettes and clothing, down to home insurance and underwear.)

My last example for the post is popcorn. If I was to watch a movie sitting on my own couch, I would not plan to eat popcorn. But if I am invited to someone’s home to watch a film, the odds of me buying popcorn rise dramatically. Why do popcorn and movies go together?  It’s a social construct – and  a way to capture my willingness to pay. (1)

Are there other examples that grate on you? Leave a comment below!

E-tax: How putting an accountant out of work can make the world a better place

This year, I started using e-tax again.

The last few years I paid an accountant to do my taxes, partly because there was no e-tax for Mac, and partly because I perceived  there would be some great benefit of getting a professional involved.

Having now been on both sides it’s time to announce my conclusion.

E-tax is, for me, a million times quicker, easier and cheaper than using an accountant. (Even though last tax year my affairs were more complicated than ever, having an ABN and business income, a redundancy payment, etc to contend with).

All the information the accountant uses is provided by me – why not just enter it into a system myself? My accountant also bothered me with physical pieces of paper (ugh!) that I had to physically sign (so medieval!). Using an accountant also gave me no hard deadline on doing my taxes – unlike e-tax – so I let it hang over my head til the following May.

When I go to e-tax, the suburban accounting industry takes a hit. They used to make a few hundreds bucks a year from me ($451 last year, I think) but now they make nothing. Doubtless, this hurts.

But this is exactly how productivity increases – painfully. When I find a way to do something more cheaply, it means someone loses a revenue stream.

The money I used to send to the accountants, I can now spend in some other way. It might go on travel, a new bicycle or dinner out at a restaurant. Some other industry will see the upside of this efficiency increase.

The story of the accountant being pushed out of work by a computer program is extremely relevant right now.

“We are now in the second machine age where robots take on mental, as well as physical work, which does encroach on a vast number of jobs” – Erik Brynjolfsson, director at MIT Initiative on the Digital Economy.

Big names are sounding out the warning:

“Software substitution, whether it’s for drivers or waiters or nurses … it’s progressing. … Technology over time will reduce demand for jobs, particularly at the lower end of skill set. … 20 years from now, labour demand for lots of skill sets will be substantially lower. I don’t think people have that in their mental model.” Bill Gates

In their mental model, the jobs are lost and not replaced. That defies centuries of progress. Could this time be different? I doubt it.

reaper
This guy (and many like him) were replaced by a single tractor

What will happen is that people will specialise in doing things only humans can do, or things where having a human do them adds great value.

These will mainly be services, but then we have a strong history in services.

We will not cease to be a social species, so there will be lots of instances in which people are prepared to pay a premium to have a human provide for them. You’ll notice the Sushi train has not yet replaced the waiter and the vending machine has not replaced the barkeeper.

What this means as well is that more and more jobs will be fun and challenging, because they are human-facing. There will be fewer book-keepers and widget makers squirrelled away in the back room never seeing another human.

Instead there will be more barbers, life coaches, counsellors, nail artists, masseurs, tailors, troubadors, baristas, chauffeurs, etc. And that’s only the existing jobs. I bet things you never thought a person could or would outsource will turn into huge industries.

I can imagine a cooking coach in people’s homes, to bridge the gap between eating in and out.  A financial adviser on call in all manner of situations – perhaps you can set up your credit card so you have to dial them up and justify your purchase every time you try to spend more than $100.

There could be cycling leaders who organise a great ride through the best terrain for the day, and make sure you’re not stranded without a spare tube. Experts that come to you to help you “homebrew” beer or make your own yoghurt. Interior designers that help you custom craft your own furniture. Cleaners that do lots of value add, by say, bringing flowers. Dog trainers, cat groomers, budgie psychologists?

Many of these already exist at small scale. The possibilities are limited only by human ingenuity and the human desire to consume. Don’t bet against those forces.

Where did all the first home buyers go?

First home buyers are off the market. The current share of 12.6 percent is around the lowest on record.

Screen Shot 2014-07-14 at 10.44.00 am

The 2000s, where first home loans grew really fast and were about as big as other home loans, looks like an outlier period, but so does the current (post-2009) period, where there is little to no growth in first home loan value

Screen Shot 2014-07-14 at 10.21.36 am

What’s happening?

I was surprised to find cutting interest rates is not helping. First home buyer shares have sunk as interest rates have fallen. On average, cutting interest rates by a percentage point cuts the share of first home buyers by three-tenths of a percent.

mortgage interest rates


Rent is a significant factor. But it seems to work in the opposite direction to what I thought. In the long-run, as rents rise, the first home buyer share falls. I found a correlation of -0.39 per cent between rents and first home buyer share

rent growth each quarter

rent cost to mortgage cost ratio
Mean housing costs for mortage holders and renters in NSW, 2011-12 dolalrs

The whole thing looks like something of a mystery. But fortuitously, while I was thinking about this, a clue arrived.

The RBA released a big paper yesterday that said house prices are fairly valued, if you assume that house prices will keep growing at 2.4 per cent a year real (say 4.4 per cent to 5.4 per cent including inflation). That 2.4 per cent is the rate they’ve grown at, on average since 1955.

The paper breaks down some of the reasons for house price growth. At the moment, low rates are propping up growth, rather than expectations of appreciation, which are negative. When rates eventually go up, expectations about appreciation will have to change, or rental yields will have to boom, or house prices will turn downward.


rba reasons for house price growth


The paper suggests that if you think house prices will grow at the same rate as GDP, you think they are undervalued, but if you think they will grow at the same rate as real household disposable income (HHDY in the chart below), you think they are overvalued.

over valued or undervalued


There’s two more points I want to draw your attention to. The 10-year figure and the 30-year figure. If you are in the market for a first home, you may have focused on house-price growth in the last ten years, and see house prices as about 20 per cent over-valued. Hello first home buyers.

If you’ve focused on them across the last 30 years (Hi Mum and Dad) you might still see houses as 20 per cent undervalued.

This is no doubt an overly neat explanation, but it must go some way to explaining first home buyer reticence at this time of record low interest rates.

Is a lack of competition causing inequality in Australia?

When I started studying economics I was 17. Young enough to be arrogantly skeptical of everything I heard. One of the many questions and concerns I had as I chomped through the stale bread of first-year economics was why we would believe that firms in competitive markets would put all their efforts into producing at lowest cost, when they could instead put their efforts into deterring competitors.

What was assumed away in the basic competitive market theory we were learning was that firms will fight hard to protect their space. Few firms operate in the unrestrained markets where they live and die red in tooth and claw. Far more operate in spaces where competitors are kept at bay, by owning a key resource (Telstra, Rio Tinto) or by making sure regulations operate in their favour (Woolworths, Commonwealth Bank). Their operations are run with an eye on costs, sure, but also with an eye on the competition.

Competition matters. Western countries run relatively unfettered capitalism because the prediction of competitive market theory is that capitalism will deliver more happiness, more efficiently. But competition is a key input to that theory. If competition falls short, we must question whether relatively unfettered markets are serving us best.

Some new research from the United States shines an important light on competition.

How America Became Uncompetitive and Unequal is a Washington Post op-ed that summarises a great body of work from non-partisan think tank the New America Foundation. It outlines how mergers and market power see prices pushed up and looks at how firms use their power to suppress workers’ wages.

“While dwindling competition hurts the vast majority of Americans, for the well-off it often proves a path to huge payoffs. Indeed, it has even become a basic formula for successful investing. Goldman Sachs in February published a research memo advising investors to seek out “oligopolistic market structure[s]” in which “a smaller set of relevant peers faces lower competitive intensity, greater stickiness and pricing power with customers due to reduced choice, scale cost benefits including stronger leverage over suppliers, and higher barriers to new entrants all at once.” Goldman went on to highlight a few markets, including beer, where dramatic consolidation over the past decade has enabled dominant companies to use their market power to extract more from suppliers and consumers — and thereby enrich investors.”

In Australia, competition policy has flickered through the news like a shooting star in the last few weeks, with a warning from ACCC head Rod Sims that privatisations are creating uncompetitive scenarios; and a Wikileak that suggests Australia’s financial sector would be exposed to competition if Australia signs a new Trade in Service Agreement. But we should wish on that shooting star, because competition is more important than ever.

“The lack of competition in America inhibits dynamism and risk taking. A New America Foundation study shows that the number of job-creating businesses that Americans start every year fell by 53 percent between 1977 and 2010, when measured as a proportion of the U.S. working-age population.”

I’ve dived into the ABS figures to see what Australia looks like on the same issue. We don’t have as much historical data as America, but the numbers are just as striking. While Australia is home to ever more businesses, the number of businesses per person has fallen from nearly ten to closer to nine.

Business numbers

The explanation for this is in the willingness of Australians to open businesses. A decade ago, 900 new businesses were registered every day. Now it is under 700.

Bu
Bu

This is not necessarily a bad thing. If people can have employment without risking their house on a business idea, then perhaps that’s a good thing. Perhaps something has changed in the economies of scale that mean our economy runs on fewer bigger businesses now.

But the coincidence of rising inequality(1, 2) and higher market concentration makes the application of vigorous competition a huge priority for Australia. If rising inequality is explained by markets becoming more cosy than competitive, that is something we should act on as a matter of urgency.

Competition is something both left and right should be able to get behind. The only people who support market power are plutocrats who grow fat on the cream churned up by insufficiently competitive systems.

Doubting Thomas: Why skepticism of economics is crucial

I remember third-year economics. The lecturer played some sort of Wheel of Fortune game where he had students answer questions correctly for the chance to guess a letter. It was around the time we were learning about how markets would reach general equilibrium if left alone. The eventual phrase spelled out “Don’t screw with our markets.”

“It’s beautiful,” said the lecturer as he delivered the mathematical proof.

“Why can’t the arts students just see this!” exclaimed the girl in the row in front of me.

Classical Economics has some beautiful theories.

John “beauty is truth” Keats may well have been a free-marketeer. But beautiful theories are a trap.

The human brain has a wide range of biases, the most risky of which is a conclusion bias. We are inclined to latch on to an answer as soon as possible, which then goes on to frame our subsequent information gathering and processing.

Of course, a beautiful unifying theory will be very tempting for us. Succumbing to that temptation explains a lot, from biblical literalists, to libertarians and communists.

But the real world is very messy, and the project of the entire enlightenment is to get us engaged with that complexity and put aside our tendency to simplify.

I’ve written about this problem before: I Haven’t Decided Yet.

Some of the most intuitively appealing theories in history (e.g. from each according to his abilities, to each according to his needs) have proved unworkable.

The point I’m driving at is well encapsulated by the parable of the fox and the hedgehog. An ancient Greek Poem turned into an essay by Isaiah Berlin, the Fox vs Hedgehog debate has been given a new life by statistical guru and seer Nate Silver.

It classifies people into two groups, foxes – who rely on lots of little scraps of knowledge, and hedgehogs, who know one big thing. Nate Silver shows that in making predictions, having one big belief can be a block to seeing the future well, and being a fox is the better approach.

(Of course, that itself is a simplification, and a truly foxy approach will accept there are times when a big simple truth is just that: big, simple and true.)

I raise this issue now because I see two big examples where a simple, hedgehoggy application of economics seems to be taking sway.

1. Our federal government. A political fox willing to try anything to get into power, Tony Abbott turned into a policy hedgehog after occupying the Prime Minister’s Office. His latest budget is the repetition of one simple trick: apply market forces. From higher education to GP visits, via cuts to social security payments, the Budget tries to fix Australia by allowing the power of markets to seep in.

It’s not nuanced but it is no doubt deeply satisfying to those elements of the base for whom the solution to the world’s problems is obvious.

2. Piketty. A French economist working on inequality, Mr Piketty has made an enormous splash in 2014. His very long book entitled Capital in the 21st Century considers a lot of evidence and distills it to one simple equation: r>g. That posits that the growth in inequality is due to a mathematical problem – the return on capital (r) is higher than the rate of growth (g). Existing stocks of wealth grow more than the paycheques of workers and so the world grows more unequal.

I do not claim to be smart enough to prove that r<g, or that applying market forces to government services will always undermine them. But I hope to be smart enough to watch the debates unfold while remembering that a simple answer pleases a simple mind.

a+b=c. Algebra can save a poor black kid’s life.

Doubling the amount of time poor kids in Chicago spent studying algebra in grade nine led to an 8 per cent increase in their high school graduation rate, and an 11 per cent increase in college enrolment.

That’s the finding of a terrific new paper out of the US National Bureau of Economic Research.

Given that US high school dropouts die earlier than graduates by 3-5 years and make up 7 out of 10 prisoners in the US, it is fair to argue that for thousands of these kids, algebra has saved their life.

The paper exploits a natural experiment whereby students in the Chicago Public School System were placed into double dose algebra classes (largely replacing music or art classes) if they scored below the national median on an eighth-grade math test. The researchers compare kids just above and below the cut-off. 

Image

Barack Obama in Chicago in 1995. Photo By Mark Pokempner

The numbers of students in the algebra courses is substantial, because maths skills are thin on the ground in the 73 public high schools studied. In the US, just 20 per cent of hispanic students, 13 percent of black students, and 17 per cent of students poor enough to qualify for free lunches are rated proficient in maths. In the Chicago Public School System 90 percent of students are black or Hispanic.

“In the Chicago Public Schools (CPS), the focus of this study, roughly half of high school freshmen fail at least one course, with the highest failure rates in math courses”

Schools assigned weak students to a back-to-back lesson in Algebra with the regular algebra teacher, and gave the teachers professional development, permitting them to use different instruction methods, including working in small groups, solving problems verbally, and having students set problems for each other.

Image

The impact on test scores was modest. But the impact on the students lives was not.

“…the test score impacts of this policy dramatically understate its long-run benefits as measured by educational attainment.”

The effect of double dosing in the first year of high school remained over time. Students who were in the program were 9.3 per cent more likely to pass algebra in that year. But they are also 7 per cent more likely to still be in school in the fourth and final year of high school.

The students who got the most out of the instruction were ones with poor reading skills. They end up passing three more subjects in high school on average, after taking the double dose, creating a 13 per cent increase in the number of poor readers who complete enough subjects to pass high school. The researchers suggest that the focus on using verbal methods to solve maths problems may explain this result.

Black students who got the double dose  also saw a dramatic effect, with a 15 per cent increase in college enrolment. For the double-dose population at large, the increase was 11 per cent. The effect can be seen in this chart:

Image

For some of these student, the impact of these classes – which their 14 and 15 year old selves no doubt dreaded – will be dramatic over their life times.