Today’s unemployment figures were SHOCKING: the unemployment rate shot up to 6.4 per cent, a whopping increase from last month’s result of 6.0 per cent, in seasonally adjusted terms.
Except.
ABS reports Australia’s unemployment (trend) skyrocketing from 6.1% in June to 6.1% in July.
— Hugh Parsonage (@hughparsonage) August 7, 2014
There are two main series that report the unemployment rate. Trend and Seasonally Adjusted. The former is more stable, the latter is more variable,.
There is a constant fight online between two gangs, the “wonks” and the “journos”. The former generally think the latter are too sensational with their taste for the more wildly variable series.

Here’s the latest update on the two series:
Trend looks like a sensible person who never gets too carried away, while seasonally adjusted is a wild ball of emotions, one moment in the dumps, the next elated.
It’s obvious which one serious-minded people should prefer, right?
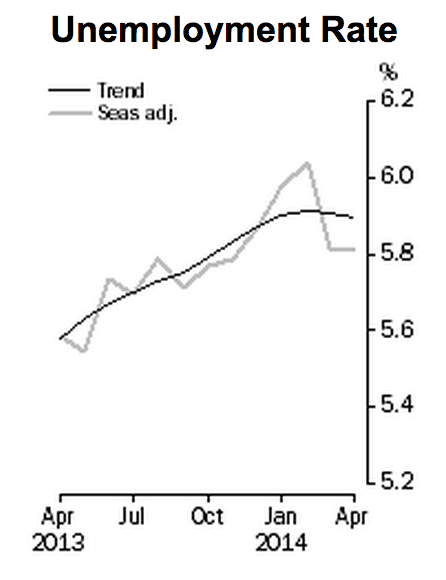
But what if I told you trend is faking it? See how it claims to be sloping up all year? Let’s go back in time and consider the countenance of our “friend” the trend back in April.
At the time, it also claimed to be feeling glum. Now it has changed its tune. Trend is like a talented politician, flip-flopping around to try to claim the middle ground and seem more reasonable than the rest.
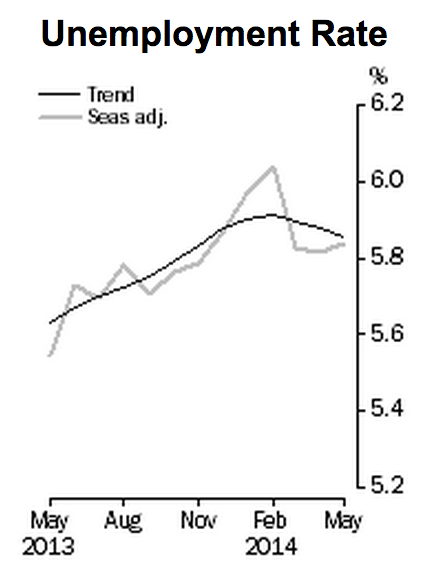
As recently as May, trend was headed downward. Then in June it made a small concession to the last two months of movement in the seasonally adjusted series: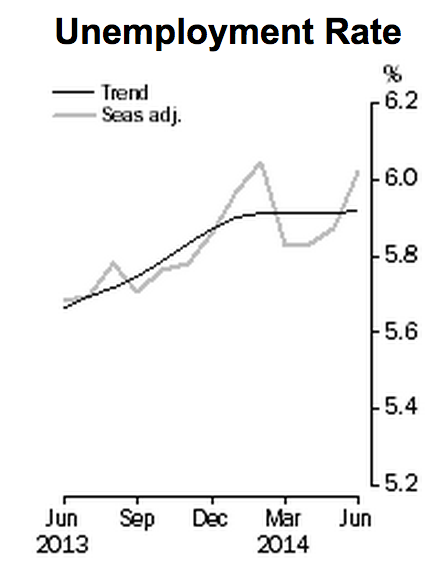 Below is how the trend is figured out. Essentially it uses a combination of old and new data to get a sense of how the series is moving over a longer time period.
“The smoothing of seasonally adjusted series to produce ‘trend’ series reduces the impact of the irregular component of the seasonally adjusted series. These trend estimates are derived by applying a 13-term Henderson-weighted moving average to all months except the last six. The last six monthly trend estimates are obtained by applying surrogates of the Henderson average to the seasonally adjusted series. Trend estimates are used to analyse the underlying behaviour of a series over time.
While this smoothing technique enables estimates to be produced for the latest month, it does result in revisions in addition to those caused by the revision of seasonally adjusted estimates. Generally, revisions due to the use of surrogates of the Henderson average become smaller, and after three months have a negligible impact on the series.”
When wonks say “the trend is your friend” they are focusing on a more than just the latest month’s data.
It’s like at the footy. One side kicks a goal and cheers. The other side points to the score, and chants “Scoreboard!” But in doing so, you can miss an important turning point.
Seasonally adjusted data look at what’s happened in the last month alone, just like the goal that just got kicked is the best measure of the passage of play that preceded it. Because it uses less data, it can also include more statistical noise.
The scoreboard, like the trend series, shows more than that and exhibits less statistical noise.
But this is a game that never ends. If you want to know what’s happening, focusing on the most recent figures seems perfectly fair to me.
