First home buyers are off the market. The current share of 12.6 percent is around the lowest on record.
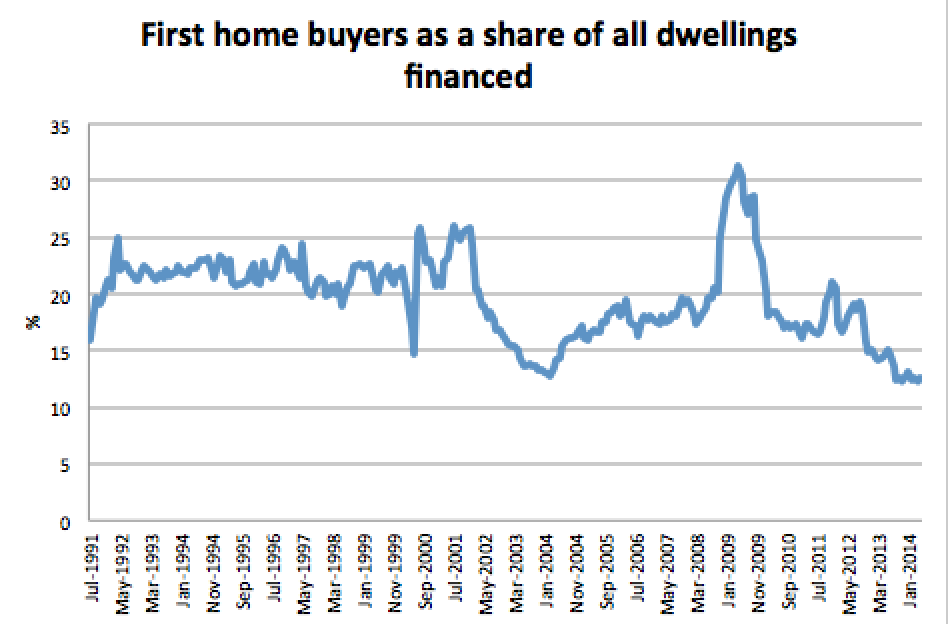
The 2000s, where first home loans grew really fast and were about as big as other home loans, looks like an outlier period, but so does the current (post-2009) period, where there is little to no growth in first home loan value

What’s happening?
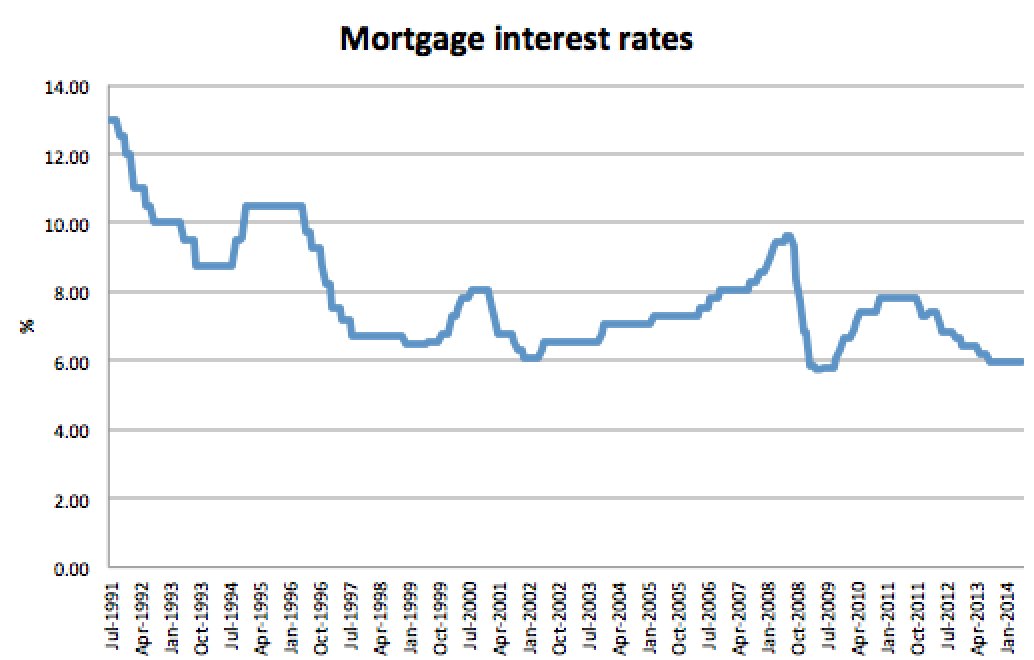
I was surprised to find cutting interest rates is not helping. First home buyer shares have sunk as interest rates have fallen. On average, cutting interest rates by a percentage point cuts the share of first home buyers by three-tenths of a percent.
Rent is a significant factor. But it seems to work in the opposite direction to what I thought. In the long-run, as rents rise, the first home buyer share falls. I found a correlation of -0.39 per cent between rents and first home buyer share


The whole thing looks like something of a mystery. But fortuitously, while I was thinking about this, a clue arrived.
The RBA released a big paper yesterday that said house prices are fairly valued, if you assume that house prices will keep growing at 2.4 per cent a year real (say 4.4 per cent to 5.4 per cent including inflation). That 2.4 per cent is the rate they’ve grown at, on average since 1955.
The paper breaks down some of the reasons for house price growth. At the moment, low rates are propping up growth, rather than expectations of appreciation, which are negative. When rates eventually go up, expectations about appreciation will have to change, or rental yields will have to boom, or house prices will turn downward.

The paper suggests that if you think house prices will grow at the same rate as GDP, you think they are undervalued, but if you think they will grow at the same rate as real household disposable income (HHDY in the chart below), you think they are overvalued.
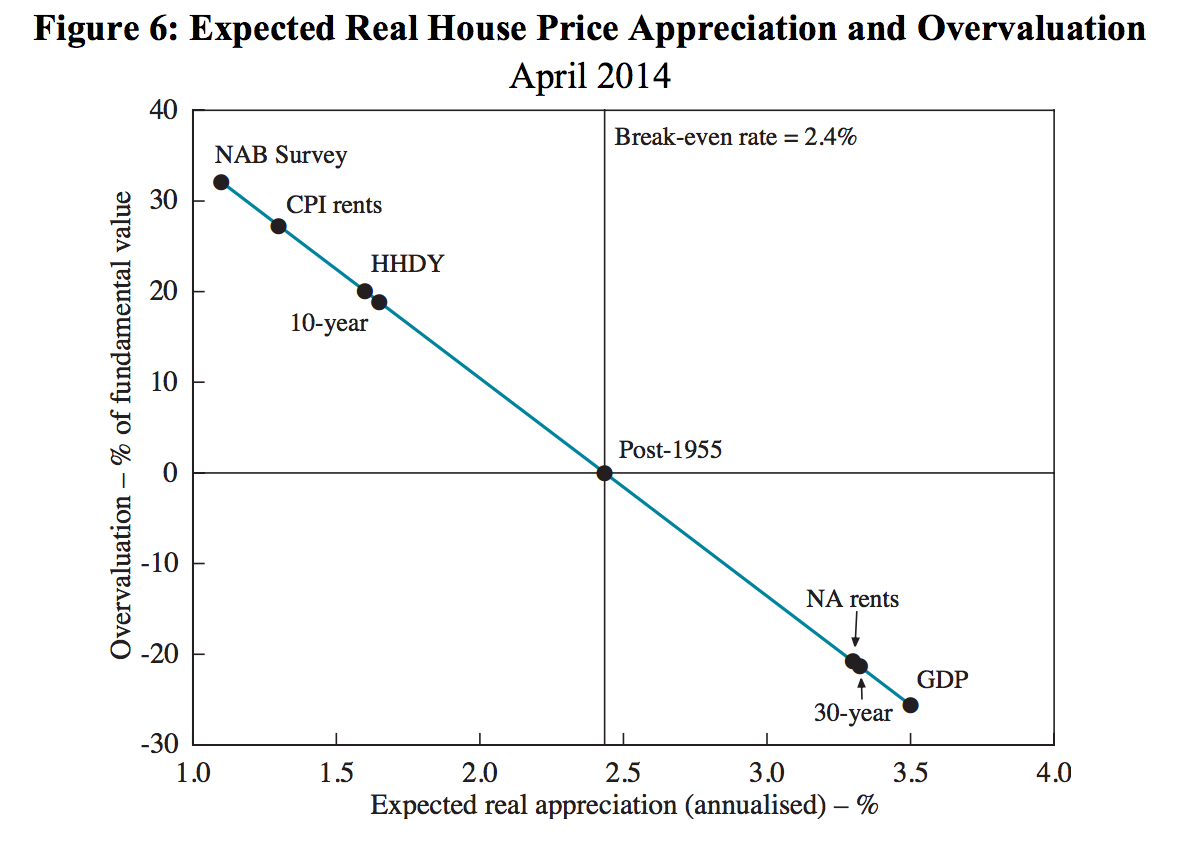
There’s two more points I want to draw your attention to. The 10-year figure and the 30-year figure. If you are in the market for a first home, you may have focused on house-price growth in the last ten years, and see house prices as about 20 per cent over-valued. Hello first home buyers.
If you’ve focused on them across the last 30 years (Hi Mum and Dad) you might still see houses as 20 per cent undervalued.
This is no doubt an overly neat explanation, but it must go some way to explaining first home buyer reticence at this time of record low interest rates.
