Canberra’s tram plan looks suss to me.

It was with some excitement that I downloaded the PDF containing the full business case for the new Canberra light rail. 

1. I love public transport.

2. I like to see open and honest planning. The Victorian government has given us no such insight into their East-West Link plan.

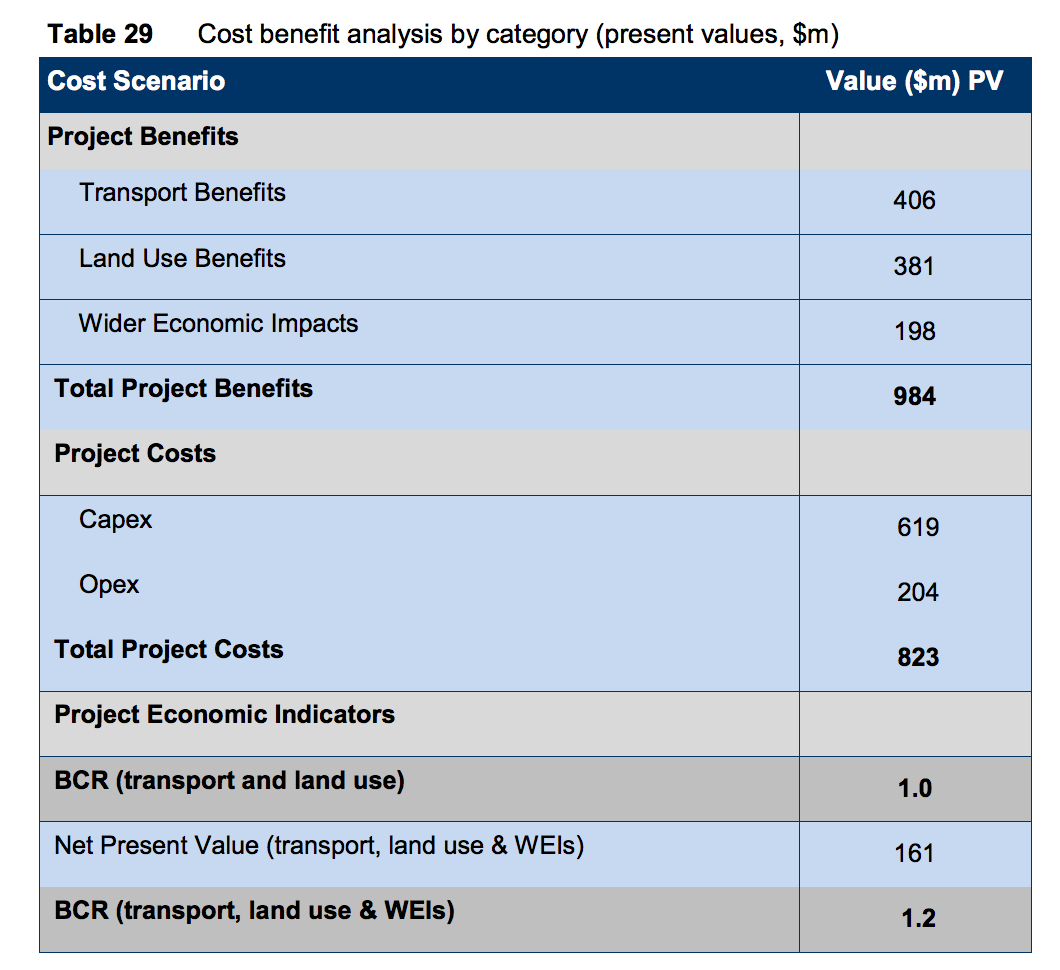
But my happiness turned to confusion when I saw the way the calculations had been made. This project supposedly has a benefit-cost ratio of 1.2. But when you look into the $1 billion of benefits, you’ll see that they are a castle made of gossamer. The $823 million of costs look altogether more concrete, and the study estimates a 25 per cent chance they will blow out to be higher still.

capital metro map
Proposed route

The most obvious benefit of the tram is time savings.

These have been calculated over 30 years, even though the operating contract for the metro is for 20 years. I am suspicious here. If you assume traffic conditions deteriorate at a given rate per annum, you could get the model to show very bad traffic in 20 years time. Including those final ten years might be a substantial source of the time savings.

And it goes without saying that trying to calculate seconds saved by tram users in 2049 requires making some heroic assumptions about the way we will live then.

The patronage assumptions also look bold. They assume 15,000 passengers a day in 2021. That’s 7500 in each direction, or 416 passenger boardings each hour for 18 hours of operation. If you assume a tram every 10 minutes that’s 69.4 boardings per tram, and if you assume the average passenger goes 6km along the 12km line, you’re guessing the tram will have on average 35 passengers on board. I’ve been on a lot of ACTION buses and that seems like 35 times as many passengers as the average ACTION bus outside peak hour.

Time savings are not even the biggest source of “benefits” in this highly questionable calculation.

tram benefit graph

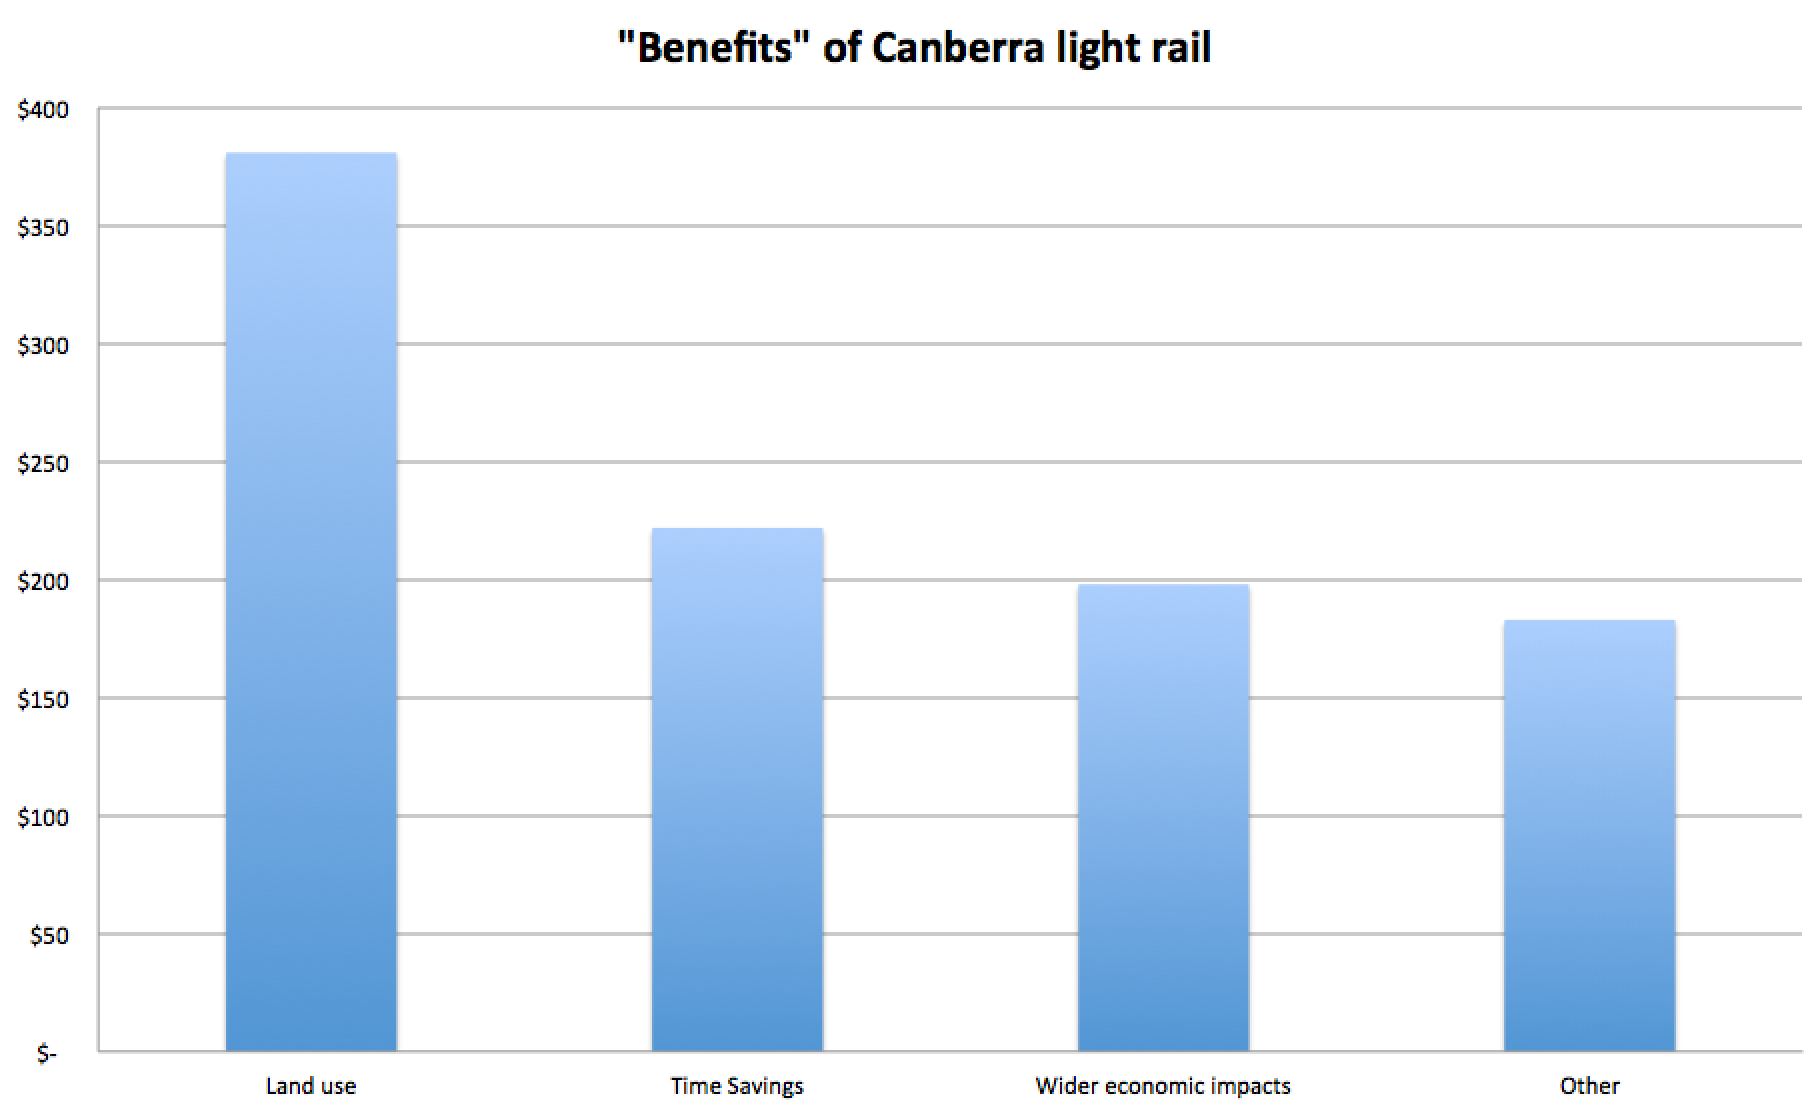
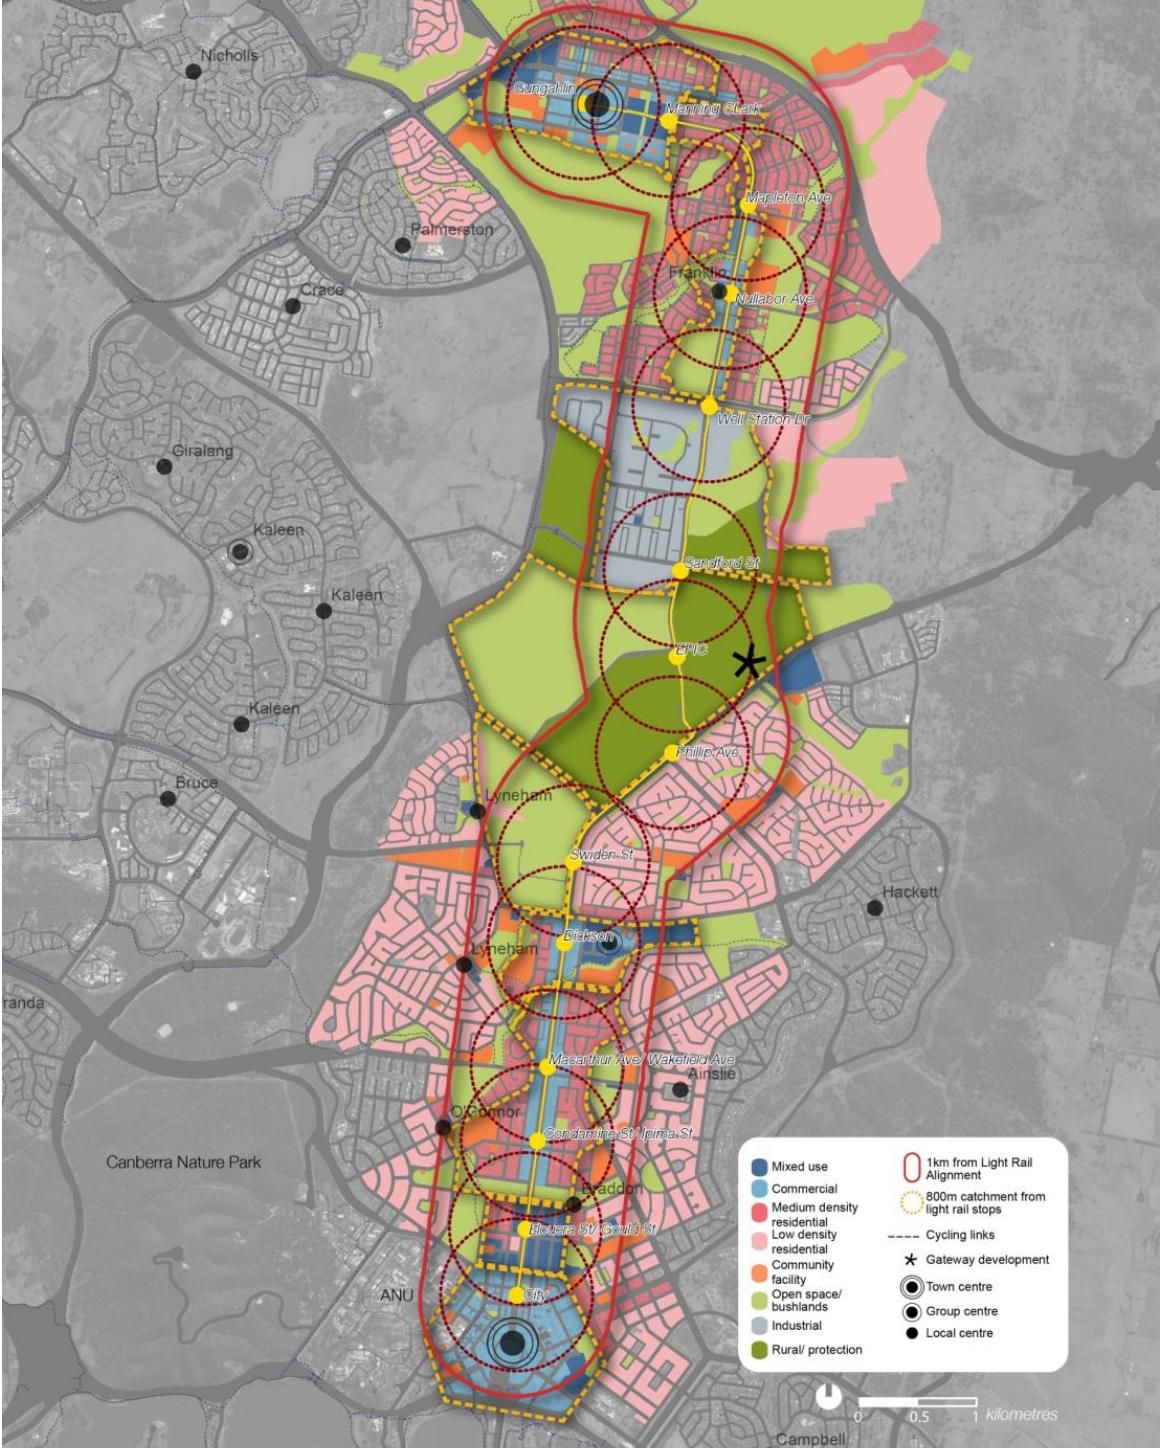
The biggest source of benefits is land use.

“Light rail and the anticipated resulting urban renewal will create a more grand entrance to the City befitting its status as the Nation’s Capital”

It is true that the drive into Canberra – down Northbourne Avenue – is grim. I moved to Canberra in 2005, and coming down Northbourne Avenue that fateful day I didn’t realise we were in the heart of the city until it had passed.

But solving that by building a tram is a bit like renovating your kitchen by installing a restaurant in your lounge room. Sure, it provides the impetus, but it’s indirect and probably pretty costly.

If you want to increase density near the centre of Canberra, the big question should be what’s the best way to do this?

If you pose the question that way, using an elaborate system of trams seems less efficient than changing the planning regulations.  The business case more or less admits it:

“Land development decisions undertaken by the ACT Government will influence the realisation of benefits by the Capital Metro project”

But it makes no attempt to say whether those “decisions” could be brought in without the tram.

The next biggest source of benefits is wider economic impacts.

Some people say wider economic benefits are the cheat’s way of boosting your benefit-cost ratio. Infrastructure Australia says that:

  • Wider economic benefits may be negative for some initiatives; and
  • the availability of Australian specific data needed to calculated wider economic benefits is currently sub-optimal.
  • Therefore, Infrastructure Australia will treat wider economic benefits separately to the traditional CBA.

It’s true that the ACT government does two calculations of the benefit cost ratio: with the Wider Economic Impacts and without.

bca

But given the project would not go ahead with a ratio of 1.0, the wider economic benefits are obviously key to the calculation.

META PROBLEMS and OPPORTUNITY COSTS

Benefit cost analyses are a GIGO model. You put garbage in and you get garbage out. Even more important than the garbage that goes in is what is excluded. here’s a short list.

  • There is no price paid for the public land on which the tram will run. The tracks will be 6.6m wide. The line is 12km long. If 11km is on public land, that is 72,600 square metres.  At $575 per square metre for undeveloped land, that’s $42 million that should arguably be included as an opportunity cost.
  • The tram has priority at all intersections. I see no estimate of how much extra waiting that will mean for pedestrians, cars, cyclists and buses that try to cross its path.
  • Cutting bus services is counted as a benefit, not as a cost.
  • The cost of the funds is not accounted for. Whether raised by debt or taxes, getting $100 for the government to spend does not cost society $100.

The cost of the tram plan is equal to $830 million. To put that in context, it’s $2,168 per ACT resident. And most of them don’t live near the 12k tram line.

The red line is the tram. The areas in the black circles miss out on any benefit
The red line is the tram. The areas in the black circles miss out


The budget for the entire ACT bus system was $123 million in 2012-13. The reason patronage is low and dissatisfaction is high is clear – low frequencies, badly designed routes and poor service hours. You could double patronage a lot more easily, for a fraction of the cost of the tram, by just improving the buses.

Myki is set to be replaced. Already.

EDIT: Additional details have been drawn to my attention and it seems the proposal is to add the paypass system to the existing Myki system, rather than wholly replace it. That, to me, seems to add even more complexity and cost and the arguments below still stand.

I feel like we’ve just got the hang of Myki.

The smartcard system that came in in 2010, finally replacing the extremely functional metcard system in 2012, had a few bad years. But now I see people touching on and off more or less correctly. There’s a lot less waving of cards near the readers and a lot less theatrical sighing.

myki shot

Nevertheless the coalition government is suggesting they will turf the system if they win power again. Transport Minister Terry Mulder has said that the government will look into using the Visa Paywave / Mastercard Paypass system at the barriers instead.

I quite like the sound of that. But I’ve learned to be wary of things I like the sound of.

Myki was supposed to be the smartcard to end all smartcards. The reason the government spent nearly $1 billion developing it was that it was supposed to be adaptive. The technology was meant to grow with the city, and give us the option to change our ticket system without changing our smartcard system.

Even the savvy were fooled. Here’s PT guru Daniel Bowen being quoted in 2006:

“It will be a vast improvement over the current system. However, some passengers may find having to scan on and off an inconvenience.”

If only the biggest issue was touching on and off!

The reality has been that the Myki system cannot even do what the previous system could do. It can’t manage short-term tickets, it fails often and it struggles terribly on trams, meaning the mantra “remember to touch on, and touch off” became untrue for (most) tram users.

Listen up, Melbourne

But the big lesson is not that Myki is bad. It’s that replacing Myki is going to be expensive. More expensive than people imagine. And the solution will almost certainly deliver less functionality than you hope. This is the lesson of big projects. They run over-budget and deliver under scope.

I’m no great fan of Myki. But let’s not repeat our mistakes by turfing Myki out before we’ve wrung the last drop of value out of it. Let’s not repeat our mistakes by assuming the new ticket system will be both easy to use and flexible. And let’s definitely not repeat our mistakes by replacing it with an elaborate bespoke system.

The temptation for a minister will be to cave to special interests, so “Simply Using Paywave” turns into a giant cluster-cuss of exemptions and special rules in special places, requiring a lot of bespoke software that fails a lot.

PT1

Lastly, let us always remember where our ticket fees go.

A ticket system is very expensive to operate. A big chunk of the cost of every ticket goes to paying for the tickets, the ticket machines, the software, the inspectors, the public servants that administer the ticket system, the inspector system and the fines – not to mention paying for the judges that hear the complaints in court. Only a fraction of your fare goes to actually making the vehicles run on time. There would be plenty of efficiencies from making public transport free, instead of using tickets.

How America failed to improve life expectancy despite driving safer, smoking less

Americans added 1.82 years to their life expectancy between 1960 and 2010, by driving safer, drinking and smoking less.

Hooray!

america traffic

But at the same time, they scarfed foods, fired weapons, and swallowed pills often enough to subtract 1.77 years from their life expectancy.

Darnit!

All the technical advancements and policy efforts that generated safe cars and better driving,  all the efforts of anti-smoking campaigners, and all the social changes that resulted in less bourbon going down the hatch,

“were roughly offset by increased obesity, greater firearm deaths, and increased deaths from poisonous substances, which together reduced quality-adjusted life expectancy by 1.77 years.” [source]

america jarritos

In 1970, Australia and America had almost identical life expectancy. Now Australia is up to 82 years and the Americans are stuck on 78.7.

life exp oecd

Americans are amazingly fat. 35 per cent of people are obese or morbidly obese, almost 35 per cent are overweight, and just under 30 per cent are a normal weight.

fatness

So it’s tempting to blame all of the downside in life expectancy on America’s famous food.

america coors

But a big part of the problem is drugs. In recent times, prescription opiates have become a huge source of deaths, at 72 per cent of all pharmaceutical overdoses.

posoningIn fact, drug overdose is the fastest moving category in the research.

table

But overall, the research has a positive message – the incredible fall in smoking and motor vehicle deaths shows that when society puts its shoulder behind a cause, it can effect change.

car fatalities smoking

The future could look very different.madmen

In the same way Mad Men depicts the 1960s brilliantly by showing everyone smoking, there may be a TV drama in 2060 that evokes the first decades of this century by making the cast really really fat and dazed on opiates. Call it the Matthew Perry show, perhaps.


How Exams Maybe Ruined Your Whole Life

Your time starts… Now. 

The exam hall fills with an updraft as a thousand students flip over the front page of the exam booklet. Some are nervous. Others feel they are in their element.

I was always in the latter group. The pressure of having two hours to show everything you know is just like the pressure of producing a newspaper story right on deadline. The marks I got on exams were almost always better than the marks I got on assignments.

Whether I studied hard or crammed like a boss didn’t matter. I generally knew the answers or a decent way to bluff, and my biggest problem would be getting cramp in the hand that wrote the essays and coloured in the little circles.

Today is the day of the Victorian Certificate of Education Maths Methods exam – one of the biggest and most important subjects. I remember that exam clearly. I had prepared more for it than any other. I spent hours doing every practice problem in the book so on the day I was the captain of calculus and I nailed an A+.

Many students will not be so calm. Many will be in a state of nervousness that will actually hurt their score.

The bad news is this will ruin their life.

New research out of the US National Bureau of Economic Research argues exam performance has long-term consequences for schooling attainment and labour market outcomes.

The way they ran their test was by finding an external factor that could plausibly disrupt student performance. They settled on air pollution, which has been shown to hurt human productivity on a range of tasks.

Students who did their exams on days with bad pollution went on to have lower scores, reduced years at university, and lower monthly earnings. (The test in question is Israel’s version of the SAT test, which is heavily weighted in university admissions).

To get the data they used air quality testing sites within 2.5 km of the schools where the tests were being run.

An increase in particulates by one standard deviation on testing day reduced test scores by 0.65 of a point (a tenth of one standard deviation), with the result mostly driven by strongly worse performances on strongly polluted days.

When the air clears, the effect on cognition also clears. But the effect of the low score plays out throughout students lives.

An increase in particulates on exam day by just half of one standard deviation reduces monthly adult earnings by $29.

“Our analysis highlights a major drawback of using high-stakes examinations to rank students. If completely random variation in scores can still matter ten years after a student completes high school, this suggests that placing too much weight on high-stakes exams … may not be consistent with meritocratic principles.”

Exams are not good preparation for real life any more. No serious job forces people to solve problems without reference to the internet, conferring with colleagues, or time to think (airline pilots dealing with a nosedive and firefighters maybe excluded).

Exams discriminate in favour of people who can go in there calm, and hurt people who didn’t get a good night’s sleep a good breakfast, who have a headache or a cold, or – for whatever reason – are wigging out.

These are likely to be talented people, who may miss out on the course of their dreams, and a subsequent job that they would have excelled at. Exams seem fair but they are not. It’s not just random bias as described above, but systematic bias too. We should call “pens down” on the whole exam system.

What happens to stolen bikes?

Bike theft now out-strips car theft in a range of inner-city Melbourne suburbs.

The Age has a nice interactive map, here.

In my postcode, 463 cars were reported stolen in the last five years and 394 bikes. But I’m pretty sure the reported statistics aren’t reflective of reality. More bikes would have been taken than cars.

Bike thefts would be unlikely to be reported to the police except when the bike was expensive enough to be insured, or when taken as part of a burglary. Simple theft off the street rarely gets reported, I bet.

Selling a stolen bike can’t be lucrative. But because bike thefts are rarely solved, the risk-return trade-off is good. This is explained beautifully in the graph below, taken from the excellent economics blog Priceonomics.

why nick bikes

But where do bikes go?

Sometimes stolen bikes are just sold on the street, as in this convoluted story that involves a man being arrested for not even stealing a bike.

But plenty of people are selling bikes on Gumtree.

Some of them are selling the whole contents of their house. That’s not suspicious.

Some of them are selling just one bike, with a big write-up and lots of pictures.. That’s not suspicious.

Then there are people selling an odd mix of bikes, often at a low price point and with a cursory write-up, like Nico, Mario, Jimbo, Joe and Carlo:

http://www.gumtree.com.au/s-seller/nico/1000852052

http://www.gumtree.com.au/s-seller/Mario/66632785

http://www.gumtree.com.au/s-seller/Jimbo/1005849263

http://www.gumtree.com.au/s-seller/Joe/1003315143

http://www.gumtree.com.au/s-seller/carlo/1000313405/date/1

Gumtree

(To be clear, for anyone interested in libel laws, I totally and fully and absolutely believe all these people are completely law-abiding citizens.)

I imagine a cheap stolen bicycle should sit in a shed for six months or so before being sold. Eager victims might scour the internet for their bike for a month or two. Doing so for more than that would be unusual.

An expensive stolen bicycle might even be thrown in the back of a truck and sold in another state. Swapping out the parts on an unusual bike might make it even harder to identify. And if you’ve got a shed full of bikes you got for free, a bit of mix and match wouldn’t be hard to do.

Apparently the one thing you can do that might change the trade-off depicted in the graph above is engraving your bike. If you put your drivers license number onto the frame somewhere, it can checked if the bike is sold. That might deter thieves. (Although exactly how you would engrave a carbon bicycle, I’m not too sure!)

An ode to PayPass (from the future)

Remember the EFTPOS minimum? Hahahaha!

What a time that was!

Back when Eftpossing was seen as a  privilege. Back when it was a hassle!

My goodness. How barbaric we were.

I recall carrying around these heavy metal discs.

Coins, they were.

God, what a pain! But under the old system, you couldn’t just pay the amount you wanted. you had to pay with whatever combination of money you had on your person.

Preposterous!

It’s funny the things we didn’t expect would improve our lives. The future is here. And there’s still no flying cars.

It turns out even something as simple as improved payment systems is incredibly hard to achieve. Nobody owns the payment system, so it’s hard to get people to invest in it.

Even Apple has had little luck making their new payment system widespread enough to please people. It’s in 220,000 outlets, but that is apparently just a fraction of all the shops people go into. And payments are about habits. You need to have your payment option available everywhere someone wants to pay.

RBA Governor Glenn Stevens spoke about the payments system last week. As well as interest rates, the RBA is responsible for managing payments.

He said this

“Overall, the record in Australia in instances where innovation requires cooperation between established players, especially where one or more of them feels the need to protect an existing line of business, is mixed… This isn’t just a problem for the industry. It’s a problem for the users of the system as well. Innovation in the ‘cooperative space’ – where no single entity has control – is critical because it is this space that determines the limits on the services that the rest of the payments system can provide.

Australia now has an Australian Payments Council to try to smooth the path to the future. The measure of their success will be forcing this yellow line down below zero.

Screen Shot 2014-10-31 at 11.32.45 am


A huge push for new payments to become a reality will come via the New Payments Platform. That’s a new payments architecture being funded by 17 major banks.

It’s very promising – so long as it isn’t crippled by vested interests along the way.

Here’s what the Governor had to say about the process of keeping those 17 banks cooperating :

“This approach, however, is not without its challenges. It requires that industry leadership and collaborative spirit be maintained over a sustained period. At various key moments the project faces the risk of that spirit breaking down….


This is where the broader governance arrangements now in place need to take into account the interests of users and the need for the system to be open to competition, not just the interests of the existing players. We – the industry and the Reserve Bank itself – are building a piece of national infrastructure. We should take every opportunity to increase its potential value to the nation, rather than limiting it for fear of where it might take us.”

I for one look forward to a time when I can take a jar of coins into the bank for the last time, burn my wallet, and leave the house without patting my hip pocket a dozen times, just to make sure.

The price of solar energy just did something amazing

I don’t write much about energy. I love economics and policy, but there’s only so many fields you can get excited about. I normally prefer to focus on transport, cities, the labour market, taxation, trade and technology.

But the developments in solar energy make the field impossible to ignore.

solar price
Source: Bloomberg

The price of solar energy is now lower than its competitors throughout most of the US. In fact, there are 36 states that are either sunny enough (California) or far enough away from the oil (Vermont) that solar will be the cheapest choice in 2016.

In India, solar is now cheaper than importing Australian coal.

In Victoria, the feed-in tariff paid by government for electricity generated on people’s roofs is 6.2c per Kilowatt Hour. Meanwhile AGL is charging 22c/ kilowatt hour for their product.

The potential of solar is enormous.

Currently, solar provides around 1 per cent of Australia’s energy. But we have the rays to make a lot more:

Kilowatt hours per square metre. Source Wikipedia

The long-time global leader in solar power is Germany. They use the sun for 3 per cent of their electricity needs. Here’s that same* map for them. Note the scale is different. Germany’s red is equivalent to Australia’s light green.

germany solar

Obviously solar is not yet dominant in Australia, and the technology is far from settled..

Even the basics can improve a lot more. For example, placement of panels. The traditional choice has been between having them fixed and having them move to chase the sun. The former is generally preferred for it simplicity.

When fixing them, obviously you should point them at the midday sun. Right? Apparently not. The smartest thing to do is point them at the sunset.  The point is not to maximise supply, but to maximise supply when demand is highest – i.e. people get home from work. The late afternoon is when traditional coal-burning power stations ramp up, and when solar can best counter the spike in prices.

The other problem with solar panels that all point at the midday sun is packing them in. Solar arrays have to use more space because the panel in front casts a shadow on on the one behind. A british academic reckons east and west facing panels can be packed in twice as densely.

Battery technology also needs to improve for solar to manage the evenings and cloudy days.

You can see the impact of clouds on this super-cool interactive and animated live map that shows the share of Australian electricity demand being met by solar panels. As I type this at 9am, Queensland is winning with 5 per cent of electricity coming from solar. Click to play with it.

Solar energy may need a boost from government, but the policy space around energy is a hot mess.

I wanted to say something smart about it, but between The Renewable Energy Target (which the government is trying to change) and the Clean Energy Finance Council, the Clean Energy Regulator, the Australian Renewable Energy Agency, feed-in tariffs and solar subsidies, the Solar Cities Program and Direct Action, I’m not sure if we end up with too little policy or not enough.

But overall I note that Australia lacks large-scale solar, which doesn’t seem ideal.

I suspect economies of scale mean individuals putting their own solar panels on their roofs won’t be the dominant trend for ever. Installation costs are pretty significant in the life-span of a solar panel. Furthermore, homes mainly use energy at night.

Costs will fall if big organisations can do solar at scale on the roofs of industrial buildings and in areas where land is cheap. Like this massive installation in rural NSW.

AGL Nyngan


I look forward to a day when you drive the Australian outback and know the bloke leaning on a fence post and chewing a stick of grass is as likely to be an electrical engineer as a drover.

How the end of Facebook will come

Facebook looks like a titan. Its empire is big enough now that its end won’t come quickly. But all the ingredients for the fall of Facebook are there already.

Facebook has 13.4 million users in Australia. About 9 million use it every day. Out of a population of 23 million, that’s almost complete saturation. At the moment many families have two generations on facebook. Before long it will be three.

You hear stories that the youth are “using snapchat instead” but I suspect most kids will have a facebook account, even if it is unfashionable to use it. It probably just takes one missed party invitation to crack and sign up.

Globally, 1.23 billion people use Facebook. That’s one in six of the world’s population.

Screen Shot 2014-10-28 at 9.52.00 am

So at the moment Facebook is everywhere. It’s the Coca-Cola of online communities – it’s everything to everyone. How can it ever be usurped?

The idea humans will only ever need one social network is wrong.

Most people are already on more than one, even if they don’t necessarily see it like that. Twitter and LinkedIn and Ello are obvious ones to mention. But online games and forums are somewhat-competitors to Facebook. So is any site on which you can make an account and leave a comment or ‘like’ an article.

As Facebook becomes the mainstream backbone of our social networking, lots of little social networks to meet specific needs will come up.

Why can’t Facebook just meet all those specific needs?

Whenever someone talks about the one big solution that will replace all the other kludges in our life – in any field – I think about the kitchen.

This is perhaps the most intensively used, tried and tested set of “apps” in human endeavour.

Mostly we need to apply heat to food. Do we have just one big heat source that does everything? Hell no. My kitchen has at least seven different ways of warming food and drink: an oven, a microwave, four gas burners of different sizes, a kettle, a coffee machine, a sandwich press, and a toaster.

Source: Wikipedia
Source: Wikipedia

Mature markets don’t offer a Swiss Army Knife solution. ‘All-in-one’ is really a synonym for ‘not very functional at anything.’ If this wasn’t true, we’d all wear those pants that zip off to become shorts.

Facebook will be the backbone of our social networking. In kitchen terms it is our stove – the one thing everyone has. But that does not mean it will be the only network we need. Everyone will experiment with a few other networks for their own preferences.

One day, one of those social media that meets some people’s needs will have a cool feature that means it suddenly has almost as many users as Facebook.

Then, the owners of that network will have a choice – do they try to become the new backbone, or do they try to remain a niche app? The rewards are probably highest in becoming the new backbone app, so they will try to knock Facebook off its perch.

Facebook’s purchases of Instagram for $1 billion and What’sApp for $19 billion make a lot more sense from this perspective.

Facebook was once just a little app for college kids to find each other. It recognises the potential for a simple and effective app to become global fast. It knows it has to prevent a competitor from rising. The easiest solution is to make your competitors your employees.

But with the payoffs to being a Facebook competitor rising, many more social networks – including things that don’t look exactly like social networks – will enter the fray. Many will end up big enough to get buy-out offers from Zuckerberg.

But eventually one of those will be owned by a young entrepreneur with a Napoleon complex who’ll turn down the offers in order to take a shot at the throne. I give Facebook ten years.

Australia and China: an unbalanced relationship.

I think this must be the most-seen three-word phrase in the history of humanity:

Made in China

Unlike liberte, egalite fraternite, or love thy neighbour, Made in China crosses national boundaries with ease, creating only a minimum of tension.

Australia, however, is in the unusual position of running a merchandise trade surplus with China.

Screen Shot 2014-10-21 at 1.14.23 pm

This graph shows merchandise imports and exports from Australia’s perspective. Somewhere around 2009, our exports to China started growing much much faster than our imports from China.

So far, so nice. But the imbalance in our relationship has another aspect.

Far more Chinese visit Australia than Australians visit China. This is intriguing.

Should we be worried about this? What does it imply about our level of interest in our #1 customer?

Do Australians not even care about the culture and the people of China?

Screen Shot 2014-10-21 at 1.13.53 pm

Or is this just the result of there being 60 times more Chinese people than Australian people in the world? Certainly it is the case that the 23 million richest Chinese are richer on average than the 23 million richest Australians. (That’s all of us).

What will be interesting to see is if there is any correlation between the exports of merchandise and the exports of tourism services. When the taste for our iron ore drops off, will our hotels suddenly lie empty?

IN the meantime, I strongly recommend Beijing, especially if you can get there on a day when it’s not too smoggy.DSC00552 DSC00631 DSC00707 DSC00834


photo (2)photo (5)
DSC00559

Buy Australian: About as sensible as F*ck Off We’re Full.

Dick Smith Foods is at risk of closing down. 

The not quite-iconic Australian brand has seen sales halve and its future is cloudy. But Aussies are voting with their feet. They are happy to buy from overseas.

Is this bad? Shouldn’t we buy Australian?

australian mde

I say buy it if the quality or price is good. But not if you have to trade off price or quality. I think this is an example of how global markets are actually a powerful force for good. Let me explain.

I like to think of myself as socially aware. But I take a Rawlsian approach to social justice. I think support is wasted unless it is aimed at the worst off. The very rich giving money to the merely rich is not really charity, in my view.

This is why I support the charity rating system Givewell. And also why I support global trade.

Trade with poor countries helps people who might otherwise live on $1 day, while buying Australian might be the difference between someone driving a car and catching the bus. Trade has helped 1 billion people move out of poverty in the last 20 years.  Those people aren’t under our nose, so its easy to forget about them when you’re considering whether to buy jeans made in China or jeans made in Australia.

The only reason to value the welfare of Australians above those of foreigners is unexamined subconscious bias. I think that bias should be brought into the open and tested for how it impacts our actions and how our actions impact the lives of others.

Here’s a little argument I got involved in online today, in response to someone noting that their crumbed fish fillets had been caught in NZ, crumbed in China and sold in Australia.:

A: Apparently that is cheaper than just doing everything in the same country

B: Oh nooooo, that would be more jobs for our people, and we’d have to pay them gasp!

Me: “our people”

C: Get back to us on this when you’re a gen Y uni graduate with no job, work experience or any connections.

So, Do you buy Australian? Why or why not? Leave a comment below.

A Harvard Professor has two big reasons China will crash (and wreck your personal finances)

China’s economic growth has been very strong for a decade, making Australia one of the richest countries in the world. China has buffered us from the GFC, boosted exports, lifted house prices and invested in our businesses.

Forecasts are for more of the same: At Budget time, Australia predicted growth of about 7 per cent for China until 2017.

But Harvard Professor Lant Pritchett is doubtful about those forecasts. The economic development expert has published a working paper full of reasons why China is far more likely to come to a bust than continuing boom. If he is right, the Australian economy will be stuffed (a technical term) and we’ll probably all lose our jobs.

“History teaches that abnormally rapid growth is rarely persistent.”

This is the unique angle of his story. Pritchett doesn’t purport to analyse China in depth. He looks at economic history, comparing China’s streak of success to other countries’ growth spurts, and predicts reversion to mean.

“regression to the mean is the empirically most salient feature of economic growth. It is far more robust in the data than, say, the much-discussed middle-income trap.”

I’m inclined to think this approach has strengths. The current trope about Chinese policy-makers is that they simply set the level of economic growth that they want.

If this is true they are the only country in the world with that power.

What do we really know about the Chinese economic policy-making apparatus? We know only that it has been very successful, according to its own statistics. And everyone acknowledges those statistics are rubbery.

Pritchett compares betting on China to investing in the best-performing managed fund – past performance is no guarantee of future performance, he cautions us.

“The lack of persistence in country growth rates over medium- to long-run horizons implies current growth has very little predictive power for future growth”

Pritchett, it turns out, really hates extrapolation:

“Paul Samuelson’s textbook predicted in 1961 that there was a substantial chance that the USSR would overtake the United States economically by the 1980s. There was a widespread view right up until the end of the 1980s that Japan would continue to grow and outcompete the world. Or in the opposite direction, consider the pervasive pessimism of even a decade ago regarding Africa. Since then, African countries emerged as a majority of the world’s most rapidly growing nations.”

His paper shows the correlation between growth in one decade, and growth in subsequent decades is low: from 0.3 for adjacent decades, down to around 0.1 for decades separated by 20 years.

“The median duration of a super-rapid growth episode is nine years… China’s experience from 1977 to 2010 already holds the distinction of being the only instance, quite possibly in the history of mankind, but certainly in the data, with a sustained episode of super-rapid (> 6 ppa) growth for more than 32 years.”

Pritchett instead suggests China will grow at an average of 3.3 per cent a year over the next decade. That means China’s GDP will be about half of what it would have been by 2033 than if it grew at 7 per cent.

Pritchett does make one concession to analysing China itself, and that is to note that growth is, on average, less variable in countries that are more democratic.polity and growth changes

“For China, continuing to have rapid economic growth while maintaining its current level of democracy (as proxied by its Polity score) … would make it more and more anomalous.”

So if China crashes, what should you do?

1. Have a job that doesn’t depend on China (BHP bad, Qantas bad, universities bad, milk exporters bad. Doctor and primary school teacher probably safe.)

2. Have a job that can survive in a downturn. (BMW retailing bad, electricity retailing good)

3. Get out of shares. Australia’s corporate profits depend on Australia’s growth, which depends on exports to China. A China collapse and a stock-market collapse would look like that Olympic event where the two divers leap from the platforms at the same time.

4. Sell your property. China props up our house prices directly (by bidding on them) and indirectly (by making us wealthy). When the firecrackers stop popping in Beijing, auctions in Australia are going to be cold and quiet for a few years.

5. Put your money in a government guaranteed deposit account (and get ready to get very little interest indeed, because the RBA will be busy cutting rates to near-zero.)

In summary, let’s all hope Mr Pritchett is really wrong.

Why the Nobel Prize is worth a little less this year.

This year’s Nobel Laureates got a raw deal.

The prize of 8 million Swedish Kronor was the least valuable prize awarded since 1990. Eight million Swedish kronor is worth $1,280,000 in Australian dollars, which is nice, sure.

But it’s not that rich when you consider the 2001 prize was 10 million krona, worth over $A1.9 million.

nobel 2012
Me, Stockholm, 2012

The value of the Nobel prize has varied a lot over time. Alfred Nobel gave the Nobel Foundation 31 million krona in his will, with instructions to give prizes to those who have conferred ‘the greatest benefit on mankind.’ The first prize was 150,000 krona, (worth 8 million krona in today’s money.)

nobel value

As the graph above shows, the foundation did a pretty bad job of protecting the buying power of the prize. The value of it fell steeply pretty much straight away. Some of the investment downturns coincided with World Wars and the Nobel Prize reached a low ebb in 1945 when its buying power was less than 30 per cent of in 1901.

Of course, that was the lucky year for Australia’s Howard Florey. Not only was his prize worth the least ever, but he also had to split it with two others, Fleming and Chain. That’s what you get for inventing penicillin.

The Nobel Foundation now has a very large sum of money. They turned the initial 31 million Krona into over 3 billion today, and give away just about a quarter of a percent of that total for each prize (of which there are six).

fund
There is detailed data only on the first year and then years since 1975. I interpolated some data after 1901 for illustrative purposes.


Nobel instructed the money to be invested in “safe securities.”

The wild variation in the blue line above suggests that is being interpreted fairly liberally.

And when we dive into the Nobel Foundation’s annual report, we can see they are invested quite aggressively.Screen Shot 2014-10-14 at 9.48.28 amSo if you have a Nobel Prize winning discovery, my advice is to save it up and release it in a year when the global stock-markets are doing well.

The real difference between Melbourne and Sydney: Longitude

People think of Sydney being north of Melbourne, but if you went due north from Melbourne until you got to Sydney’s latitude, you’d be 580km due west of the Opera House.

In fact, the east-west distance between Melbourne and Sydney is almost exactly the same as the east-west distance between Melbourne and Adelaide. (Both are just over 6 degrees of longitude difference).

The result of this is different times of daylight. A good friend of mine who works between Sydney and Melbourne says the early sunrises in Sydney get him up and running before work, which he never does in Melbourne. But he misses the languid light of Melbourne’s evenings after leaving the office.

Both sunrise and sunset are later in Melbourne, all year round. This graph shows sunrise, and sunset a for both cities. Melbourne is the yellow and red lines, Sydney the green and purple. The difference is almost an hour.

Sydney v Melbourne
Source

The difference manifests itself in interesting ways. I reckon Sydney’s surf culture is nourished not just by the warmer weather and better beaches, but also by the fact there’s hours of sunlight before work. The pop-culture phenomenon that is Aquabumps could only thrive in Sydney.

There’s evidence of a much stronger early morning workout culture in Sydney too.

Screen Shot 2014-10-13 at 11.04.45 am Screen Shot 2014-10-13 at 11.04.35 am

Further evidence: The Milson’s Point pool opens at 5.30am. The Fitzroy pool opens at 6am.

The Sydney-siders seem to be making the most of their early mornings. Are we Melburnians missing out?

What we get is a bit more evening time to spend outdoors. This works well for Melburnians in summer, when, for example, the Sydney Botanic gardens shut at 8pm and the Melbourne Gardens are open til dusk.

Melbourne Sunset. When I took this shot, it was dark in Sydney

Much like daylight savings, being further west in a timezone moves daylight to the after work hours.

The great advantage of having more light in the evening is supposed to be using less power around the home. But because of the different energy mixes between Melbourne and Sydney, (the southern capital uses a lot more gas) and the temperature differences, it’s hard to compare. And with the declining role of lights in electricity use, and the rising role of air conditioning, sending people home from work in the heat of the day may have the opposite effect.

So which is better?

The concept of solar time means you can measure which timezone is closer to “accurate.” This maps shows Melbourne is in the red, with an assymetric sort of day, and Sydney closer to balanced. If Melbourne’s time zone explains my tendency to get up late and stay up late, it has a lot to answer for.

adherence to mean solar time


The case for finely balanced time-zones is most obvious where they are absent.

China uses just one time zone, creating giant differences between one end of the country and the other. During daylight savings, the sun sets at 10pm in Lhasa, and two hours earlier in Shanghai.

lhasa shanghai

The vast majority of the world is in the red, suggesting people like the evening hours to be daylight. But if you look closely, a lot of very dynamic cities are in the green parts of the map: Tokyo, New York, LA, Shanghai. Perhaps there’s something to this “early to bed, early to rise” idea.

Should Melbourne perhaps change time zone? If we moved to Adelaide time, we’d see sunrise as early as the Sydney-siders do. Then the only reason not to spring out of bed and do exercise would be the weather!

The Behavioural Economics of going to War

America and Australia are going to war against ISIS in the middle east. I feel this represents a failure of thinking. Can we use the same psychology that informs behavioural economics to explain this kind of mistake?

Action bias

In the face of what looks like a problem, people tend to want to do something it. Our leaders are no different. They have vast policy-making departments that can give them options for action. The military is one of these, and they are able to present a diverse suite of choices with different risks and costs. Once a range of military options is outlined, the problem is framed in such a way that inaction looks like an extreme choice.

Action bias is a common criticism of government, especially from conservatives:

“Regulators are like the rest of us. They are over-confident, thinking they can understand complex behaviour. Hindsight bias leads them to believe events are more predictable than they are. And, unsurprisingly, they are driven by action bias – a tendency to favour interventionist solutions when faced with a problem.” Chris Berg

They are far more quiet about foreign policy than domestic markets for some reason.

Over-estimating one’s ability. 

Australia and America would surely not go to war if they thought it would be, as has been predicted, an awful failure. Are we more at risk of over-estimating our ability to solve this problem, or under-estimating it?

Clearly the bigger risk is over-estimating.

“Humans are overconfident creatures. Ninety-four percent of college professors believe they are above average teachers, and 90 percent of drivers believe they are above average behind the wheel. Researchers Paul J.H. Schoemaker and J. Edward Russo gave computer executives quizzes on their industry. Afterward, the executives estimated that they had gotten 5 percent of the answers wrong. In fact, they had gotten 80 percent of the answers wrong.” David Brooks in the NY Times


This war may like most other recent wars, end in failure. But that risk is not easy to perceive by use of human intelligence.

Conflation of skills

People assume tall people are good leaders, that beautiful people are skilled, that great footballers will make great coaches, or that Einstein’s views on politics are worth listening to.  We suffer from a bias that lets us believe skills spill over from one area to another.

The US military is very strong. We use the word “powerful” to describe it. But that is principally the power to deliver heat and kinetic energy to precise locations in order to destroy things.

Have we asked if that power is what is really needed to stop ISIS?

To my mind, the fundamental problem is not the existence of the organisational structures, but the attitudes that make people want to join it. If you destroy the structures in a way that fan those attitudes, you get stuck in a growing problem.

This is where the “power” of the military is not necessarily a problem solver. For every ISIS member you kill, you might radicalise on average 0.6 friends, 0.4 brothers, 0.4 sons, 0.2 uncles, 0.2 neighbours. It’s possible every enemy killed creates 1.8 enemies (just as a hypothesis).

Every innocent person you kill probably radicalises many more people. And the deaths of innocents are just about guaranteed whether you use airstrikes or boots on the ground.

In summary, sending the military to solve the problem may be like making the best looking employee into an executive. There’s a cognitive bias at work that may mean we’ve made the wrong choice.

Game theory.

ISIS could be quietly building its support base. Instead it has taken a high-visibility approach of televised beheadings. This seems provocative. If ISIS is deliberately drawing the west into war, should that not give us pause to consider where they payoffs of any war are? If its war they are after, why give them what they want?

This is just a quick summary of a few things that may have gone wrong in this decision process. It’s not supposed to be comprehensive, and of course, I’m not a foreign policy expert. If you have thoughts on these issues, I’d be grateful if you would leave a comment below.

Terror and travel: What changes where Aussies go?

The data for overseas arrivals and departures was released today and I decided to see if there was any sign this latest ISIS conflagration was changing Aussies’ travel.

August travel


This chart shows the travel by Australians to Indonesia, Malaysia, Egypt, Turkey, Lebanon, UAE, Pakistan and an ABS category called “Other Middle East and North Africa.”

If the government is trying to instil fear, it hasn’t been that effective, apparently. Let’s look at a longer time scale.

travel to islamic countriesThe red line gives us the simple answer. You can’t put the frighteners on us for long. Record numbers of Aussies are out there in majority Muslim countries, from Bali to Karachi.

(It’s worth noting that the number of Australians who identify as Muslim increased from 280,000 in 2001 to 480,000 in 2011. Some of them have family backgrounds in these countries, and might account for a modest share of that increased travel, so it isn’t all exploratory tourism.)

The share of total travel going to that group of countries dips from a peak in 1998 to a low in February 2003. It might be tempting to blame that on the terrorist attacks of September 11, 2001, but half the fall had already happened when those attacks occurred.

The reason for the peak and the pre-2001 fall is prosaic and sensible. IN 1998 opportunistic Aussies were riding a wave of Indonesian exchange rate appreciation that pulled back by 2000.

AUD IDR

September 11 may explain a short blip but a more powerful explanation for the weakness in the middle of the graph is the 2002 and 2005 Bali Bombings. Both these events had sharp effects on travel to Indonesia.

Screen Shot 2014-10-07 at 1.35.28 pmBut by 2008, that effect had passed.

And it seems Aussies weren’t turned off Islamic countries in general. In fact, between the 1998 peak and now, the numbers  of Aussies visiting Islamic countries rose 150 per cent.

And we’ve been more willing to get off the beaten path of Indonesia and Malaysia. The following graph shows how the shares changed.

destinations 1998

destinations 2014

Statistics show Australians aren’t as jerky and petrified as the opinion leaders might think. I’m not surprised.

Let’s hope some of this tourism helps spread a message that even if our government falls into the trap of following the US into war after war, friendship is possible between Australian people and people of Islamic states.


What will you buy more of when you are rich?

Want to know what you’d do if you suddenly got rich?

One way to find out is to listen to rappers.

Iggy Azalea’s track Fancy suggests the money of a wealthy Australian rapper goes on booze, clothing, watches.

“Cup of Ace, cup of Goose, cup of Cris
High heels, somethin’ worth a half a ticket on my wrist”

A very nice new dataset from the ABS allows us to check whether Iggy is reppin in a way that is actually representative.

Alcohol spend

Data confirms Iggy is legit. Rich people spend more on alcohol. The top quintile by equivalised disposable income is spending 3.5 times as much on booze as the bottom quintile.

As for high heels and watches? Clothing shows a similar pattern, but not as pronounced. For every dollar a poor person spends, a rich person spends three.

Unlike alcohol spending, the expenditure shares are skewed to the very top. Someone in the very top quintile spends 34 per cent more on clothes than someone in the second top group.

Clothing So rappers seem to be a good subsitute for data. What about cartoonists?

Cartoonists often show the rich smoking cigars – they’re a classic trope.

cigarettes spend

Sadly this depiction is not backed by the data. When you’re in the top quintile by equivalised disposable income, you’re actually going to spend less on smoking than anyone else. So if you’re trying to fake it before you make it, don’t trust the cartoonists – throw out those Romeo y Julietas. 

What about TV shows? Can we trust their depictions of the lives of the wealthy? In The Slap – perhaps my favourite Aussie TV show ever – the richest character is Harry, who has a fancy house and a nice german car. Is that accurate?

vehicle purchase spend

The rich buy nicer cars. Far moreso than the poor, with a ratio of 3.3. But notably, not much moreso than the next bracket down. If you want to really foretell how you will spend when you are truly rich, you have to look beyond the driveway to the house itself.rent spend

If its rented, that’s a fair sign you’re not in the top bracket. The richest income bracket spends less on rent than the poorest.

But they spend more, a lot more, on housing overall. (Note the scale on the vertical axis. The ratios may be less dramatic but the raw numbers in this graph are the biggest).

imputed rent

(This graph shows imputed rent, which allows comparison of owner-occupiers).

So thanks TV for being careful with your depictions of the wealthy. The classic big car and big house are true signs of wealth.

But they are not the category that shows the most dispersion. The truest single sign that you’re now loaded is that you get your shampoo out of a tiny little bottle.

Accommodation spendWhen you are rich you might have a lovely house (or two), but you will spend a lot more time in hotels. The ratio of 7.9 between the richest and poorest quintiles is the strongest difference of any of the categories.

Globally, the super rich even live permantly in hotels. In LA, the Chateau Marmont is famous for having celebrities check in for years at a time. And don’t forget Coco “The Ritz is my Home” Chanel.

The second sharpest spending difference between rich and poor is in a category I’ve never seen mentioned on TV and a category only one rapper I know of has ever mentioned, and that’s insurance.

Insurance spend

Kanye West name-checks Geico insurance in the 2005 track Gold Digger. it’s not sexy, but there you go. More money, more problems, and more insurance against all those problems.

So that’s a summary of where your disposable income will and won’t be going when you’re loaded. But it’s not the end of the story. Because some of your income isn’t disposable. To find out what I’m talking about, let’s check in with poet/musician/millionaire, George Harrison, and his 1969 song Taxman.

tax spend

Australia in 2014 might not have a 95 per cent wealth tax like Britain did in the 1960s, but the wealthy still pay a lot of income tax. We’ll know Iggy Azalaea’s not just faking being rich when she channels her George Harrison and releases a song about Treasurer Joe Hockey.

As the New York Times cuts jobs, we need to consider radical ideas to save news.

“What Newspaper do you read?”

This was once a fair question. But if I asked it in earnest now, you’d laugh. Nobody reads just one. Not any more. We harvest good articles from across the web.

Just this morning I’ve read content on two blogs (1 2 ) , six different news sites, (1 2 3 4 5 6) a think tank and visited seven social media / forum sites ( 1 2 3 4 5 6 7 ). But I only have a couple of online subscriptions.

We are reading more content than ever. And yet venerable institutions like the New York Times are still cutting jobs.

“The job losses are necessary to control our costs and to allow us to continue to invest in the digital future of The New York Times, but we know that they will be painful both for the individuals affected and for their colleagues,” said the company in a statement.

Everyone knows that eyeballs are now online, and everyone knows that the rivers of gold that were classified advertising have dried up. News sources are combatting these issues by building terrific websites, and by doing a range of smart but suspect things to raise money, like native advertising.

But I say there is a third trend that is wreaking havoc on the newspaper business. It is not hidden but its implications are not widely discussed.

That is that people don’t just read one news source any more. They won’t subscribe because they can’t choose which one to subscribe to.

Instead of talking about this, the debate about winning subscriptions to online journalism is crazily caught up in the weeds:

e.g. Boston Globe drops paywall, adds meter instead. 

Each individual news company is wringing its hands, frowning and wondering why nobody will pay $400 to subscribe.

This focus on what you individually can do better leads to worrying about the micro scale. For example, fussing over how much content you reveal before the jump:

“But I wonder if we’re about to see news writing being taken in a new direction as paywall journalism takes over. For the wrong reasons, the rules are being rewritten. Most publications with paywalls allow the reader to see the headline and the first paragraph or two. To read more you have to pay. So with a one fact story – Fred X has been named as the new boss of Company Y – there might be insufficient motivation for the non subscriber to subscribe – unless they can be tantalised. Instead, we’re moving to a situation where intros absolutely cannot get straight to the key fact. Instead, it must be written to intrigue the reader. Company Y has named its new boss. To read more, please log in…” – Mumbrella

But if they want to answer why loyal readers don’t seem to be willing to pay the same to access the same stories when they are presented in digital format, just look at consumer behaviour. We are no longer loyal.

In the 1980s, the remote control and cable TV spread across America like wildfire. The internet is to news what the remote control was to TV. We don’t just watch one station any more. I believe the lesson of TV can be applied to online news – big money can be made by bundling.

Put it this way: would you pay to subscribe to just one TV channel? How would you choose which one?

Cable TV works by selling you lots and lots of channels. That’s what online news sources need to do.Our budgets to spend on online news are unlikely to have shrunk. News sites need to find a middle man that can bundle their product up and capture all those individuals’ budgets.

Here’s the core of a perfect bundle to sell to me:

  • The Age
  • The AFR
  • The Australian
  • The Economist
  • NY Times
  • ESPN
  • AFL.com.au
  • The Times
  • South China Morning Post
  • Bloomberg
  • Reuters
  • Crikey
  • New Matilda
  • Wall Street Journal
  • Financial Times
  • The Atlantic
  • The Washington Post
  • Forbes
  • The Guardian
  • Slate.com
  • Vox

There would also be lots of other sites in the mix that I never look at, and which I constantly grump about “paying for”. That’s the cable TV model and it works.

But it won’t be easy. Here’s why it hasn’t been implemented yet.

Putting competing newspapers behind a single paywall would make the owners and editors of those newspapers extremely nervous and uncomfortable. From an institutional perspective, it feels both ridiculous and impossible to achieve. It requires looking at the news business from a totally different angle. It also has significant start-up and coordination problems.

But from a reader perspective, it would be completely natural and neat and helpful to be able to subscribe to everything you want to read and neither run into paywalls nor constantly expect your preferred titles to disappear.

Furthermore, bundling could help the news industry improve. In cable TV, each channel tries to specialise to earn its place in the mix.

The process of stealing breaking news, features and soft stories, which is currently consuming the news industry, could be diminished if the financial security of each channel depended more on differentiation than same-ification.

You could imagine the middle man that solves the question of news subscription bundling being a Murdoch. But it would not have to be.

Twitter already serves as a kind of news site aggregator. Imagine a world where twitter filtered tweets into two columns: those that link to sites that you subscribe to, and those that link to other sites. You’d never have to hit a paywall again, and even better, you could share paywalled material without feeling like you let your social media followers down.

“Degrowth” to save the world: is there any merit in the idea?

The Conversation has published an article by a Research Fellow at the Melbourne Sustainable Society Institute, entitled “Life in a de-growth economy and why you might actually enjoy it.”

I saw it get some approving shares on social media, and it has collected a bunch of adulatory comments.

The topic is close to my heart- the costs and benefits of economic growth. This is surely one of the biggest issues in social science right now and I am delighted to see it get an airing. The piece also touches on the limits to growth, which I am fascinated by.

This week I found a flat screen TV sitting forlornly in a pile of hard rubbish. I took it home and plugged it in. It works. The level of affluence we have and our willingness to throw things out is, to me, confronting.

Dusty but functioning...
Dusty but functional…

So I am primed to hear someone ask the tough questions of our economic system. However, the level of analysis in this report is … *cough* … uneven.

“Degrowth would liberate us from the burden of pursuing material excess. We simply don’t need so much stuff – certainly not if it comes at the cost of planetary health, social justice, and personal well-being. Consumerism is a gross failure of imagination, a debilitating addiction that degrades nature and doesn’t even satisfy the universal human craving for meaning.” 10/10 True. 

“To be distinguished from recession, degrowth means a phase of planned and equitable economic contraction in the richest nations, eventually reaching a steady state that operates within Earth’s biophysical limits.” 10/10 for the desirable endpoint.

“Degrowth, by contrast, would involve embracing what has been termed the “simpler way” – producing and consuming less. This would be a way of life based on modest material and energy needs but nevertheless rich in other dimensions – a life of frugal abundance.” 0/10 How the living heck do we get from here to there.

“In a degrowth society we would aspire to localise our economies as far and as appropriately as possible. This would assist with reducing carbon-intensive global trade, while also building resilience in the face of an uncertain and turbulent future.”

minus 10/10 Don’t blame trade. Shipping is the most carbon efficient form of transport and contributes just 3 per cent of global carbon emissions.

In fact, trying to cut emissions from trade probably hurts the environment. The carbon effect of trying to produce locally is often worse:

“One recent UK report found that the greenhouse gas emissions involved in eating English tomatoes were about three times as high as eating Spanish tomatoes. The extra energy and fertilizer involved in producing tomatoes in chilly England overwhelmed the benefits of less shipping. Even New Zealand lamb produced less greenhouse gases than English lamb. Berkeley graduate student Steven Sexton estimates that an American switch to more local corn production would require 35 percent more fertilizer and 22.8 percent more energy.” [source]

The problem with the degrowth argument – as presented in this piece – is that it has no sense of the dynamics of an economy. Motivated by a clear vision of a utopian alternative, it simply flicks the pages of the book until we are at the end.

The closest it gets is this:

“Actions at the personal and household levels will never be enough, on their own, to achieve a steady-state economy. We need to create new, post-capitalist structures and systems that promote, rather than inhibit, the simpler way of life. These wider changes will never emerge, however, until we have a culture that demands them. So first and foremost, the revolution that is needed is a revolution in consciousness.”

Here are the problems I foresee with trying to set up “post-capitalist structures”:

1. When the economy is in a sharp growth phase, it tends to deliver wealth to the rich first, then spread the benefit. When the economy is in a sharp contraction phase, it tends to be the poor that are hurt. I’d be very surprised if “planned and equitable contraction” were even possible without spreading shortage to the people who could least manage it.

2. The governmental resources required to supervise the economy on such a scale remain unknown. What policy levers need to be pulled? If you need to expand the government to effectively supervise the shrinking of the economy, do you not need profitable businesses to tax?

3. Gucci handbags come with influenza vaccines in them. (Metaphorically speaking). Growth is not just wanton consumption. It’s also improved infant mortality rates, more recognition and better treatment of mental illnesses, better educations.

4. But even wanton consumption has positive side-effects. China’s adoption of capitalism has lifted hundreds of millions of people out of abject poverty and given them hope for a better life. That growth is due in part to rich westerners buying frivolous Chinese-made goods. De-linking the rising affluence of the poor from the rising affluence of the rich is to miss cause and effect. We’re all in this together.

5. Global coordination. Attempting to institute post-capitalist structures single-handedly leaves you a bit like North Korea.

6. Population. If growth cuts fertility rates, what effect will de-growth have? Would a Chinese style population policy be required to prevent global population growth from accelerating?

7. Economies are amazingly tough. If you try to squash them, they’ll just keep on bobbling up. If you outlaw them, they’ll survive. A de-growth economy is going to have to be enforced in a coercive fashion, and exist alongside a thriving black market.

So, having given the “de-growth” idea a kicking, do I have anything positive to add?

I think I do.

It sounds prosaic, but the answer to the very real problem of environmental degradation exists and does not require inventing a whole new approach.

The solution is in raising the cost of harmful activities until they are performed only at acceptable levels.

Policy actions like instituting a carbon tax are within our grasp. We’ve already cut emissions of chlorofluorocarbons. We can police water pollution and  the fishing of dwindling populations and the elimination of natural habitat.

The problem of equality can be solved too, using the awfully yawn-inducing tools we already have in our grasp: Things like land taxes, income taxes, tax credits, and publicly funded schooling are enough to shape the world into a more desirable form. To think we’ve exhausted their power is to think small.

But I can see a role for the de-growth movement.

A movement for social change will be more radical than the changes it is able to effect. If de-growth were to become a more popular idea, it would provide serious impetus to the sensible solutions I mentioned above.

So I won’t think less of you for promoting de-growth – so long as you don’t believe in it.

Jocks not nerds: Why dumb politicians may be better.

The era of the warrior king was awe-inspiring. The leader that rode his troops into battle, survived arrow puncture wounds and chopped off a dozen enemy heads really earned the right to sit on that throne.

Richard iii shortly before his reign ended, at the Battle of Bosworth
Richard III – shortly before his reign ended – at the Battle of Bosworth

But over time, it became clear that the two skill-sets – sagacious governing and vigorous neck-hacking – were rarely found in the same individual.

We saw specialisation and gains from trade.

Kings paid knights to do their warring for them while Knights benefited from having a bookish type on the throne – someone inclined to spend hours contemplating the merits of the laws, rather than lifting heavy rocks.

So we come to modern politicians. There’s a lot of complaints that these people are  “too dumb”.

But is that fair? Since when did we expect the parliament to do the heavy thinking to come up with new policies?

That’s why we have the public service, the think tanks, the vast commentariat. There is no shortage of good ideas in Australian politics. Take today’s call for the end of negative gearing, for example. That idea doesn’t need to be invented, just implemented.

What we need in parliament is people who can make parliament work.

We need coalition-builders. We need people other people are happy to follow. We need people who can bolt together a coalition of interested parties to make something happen. We need leaders.

If your community is chock-full of bookish types, then they may be delighted to be led by a former university professor.

But will that inspire and delight the community at large?

PUPS

Recent evidence says no.

I’m not saying the level should be brought down that low, mind you. The politicians still need to be able to tell a good idea from a bad one.

The Dunning Kruger effect, wherein a person may be too stupid to tell they are stupid, is an ever-present risk among candidates for parliament. Many of them self-select, thinking they are the first person who ever wanted to take “common sense to Canberra”.

The structure of the political system also influences who you should vote for. If one person will rule, you want a sensible centrist. But where there’s lots of negotiation, you’re better off sending a hardline crazy person. (This may explain the Senate.)

There’s a roughly translated quote from Plato:

“Those who are too smart to engage in politics are punished by being governed by those who are dumber.”

That may have been true once. But these days we are barely governed at all. Years pass without any real reform, while reams of sensible but bold recommendations printed on glossy A4 blow emptily round the inner-city streets of Canberra.

So don’t be afraid to vote for a Jock. Someone who seems smiley and friendly and very popular, if a little bit dim. Someone whose electoral success is not explained by a dazzling academic CV. They might be the the exact politician we need.

The Australian dollar has just tumbled. How should that make us feel?

The Australian dollar has just tumbled. How should that make us feel?

Well for starters, you should feel poorer. If you have any positive number Australian dollars, they are now worth less in international markets.

AUD SEpt
Source: RBA

That’s a 6.2 per cent fall against the USD and a 4.5 per cent fall against the trade-weighted index during the month. That makes imports more expensive

If electricity prices or taxes went up that much, we’d have hyperventilating shock-jocks all up in our front pages. But when the dollar moves that much, the silence is tangible.

That’s actually crazy. We spend far more of our money on imports than we do on electricity. We spend a similar amount on imports as on taxes.

share of wallet

If there is no locally made equivalent for what you like to buy (e.g. a laptop computer, quality coffee, petrol, most clothing) you’re just stuck paying more for what you love. But before your weeping becomes unconsolable read on: a lower dollar could actually do some good, eventually.

The benefit to the Australian economy works in two ways:

1. Australian exports start to look cheaper, and they sell more.

The upside will be extra apparent to you if the company you work for does exporting. Exporting is rarer than you might think. Just 2 per cent of Australian firms export (although obviously they tend to be bigger firms with more employees).

If you work for BHP Billiton, CSL or a school that teaches English to international students, your employer should find sales lifting without any extra effort, and you should find that the payrises start flowing a little more easily. Beauty, mate!

2. Consumers start buying Aussie products, not the imported equivalent.

If the product your company makes competes with foreign imports (including overseas travel), the fall in the dollar will help. Maybe your company is in food production or owns hotels on the Gold Coast. If so, plan for better times ahead. But don’t get overexcited.

The time it takes for a lower dollar to flow through to higher-priced imports can be long. While some things like petrol are traded frequently on world markets, most imports have their prices locked in well in advance.

So, on balance, how should you feel about the lower dollar? It depends.

  • If you’re a big fan of buying Australian made and you think foreigners should be too, happy days are ahead.
  • If you’re a connoisseur of foreign made products or a fan of international travel, then it’s more gloom and doom.
  • If you work in the Australian economy, then you can (gradually) start to whoop it up.
  • If you’re retired and you mainly consume the output of the Australian economy, then things look less rosy.

This is at once the blessing and the curse of writing about economics. It’s the Kurt Vonnegut effect: there’s no simple story – no absolute doom and gloom.

Every change in price that hurts someone helps someone else. Even if this seems like a windfall to you, the polite thing to do is re-arrange your face into a neutral position and carry on with your day.