Australia, you are rolling in it. You’re loaded. Flush. But you don’t seem to realise.
Perhaps you imagined that when you got rich you’d never face trade-offs again. But even Bill Gates has to choose between solving Malaria and distributing the internet.
Trade-offs (“do I buy a new car, or pay off the mortgage on this three bedroom home?”) are uncomfortable. But that is not the same as material discomfort.
Labor’s Joel Fitzgibbon this year claimed people in his electorate with income of $250,000 are struggling. If we lose sight of the fact that we are loaded, it creates a political problem. We stop realising we can save and invest for the future, and we become obsessed with feeding ourselves today.
So, for perspective, here are Australia’s personal income levels – from the top of the poorest ten per cent to the bottom of the richest ten percent – compared to per capita GDP across the world. Perhaps we can picture material wealth better this way.
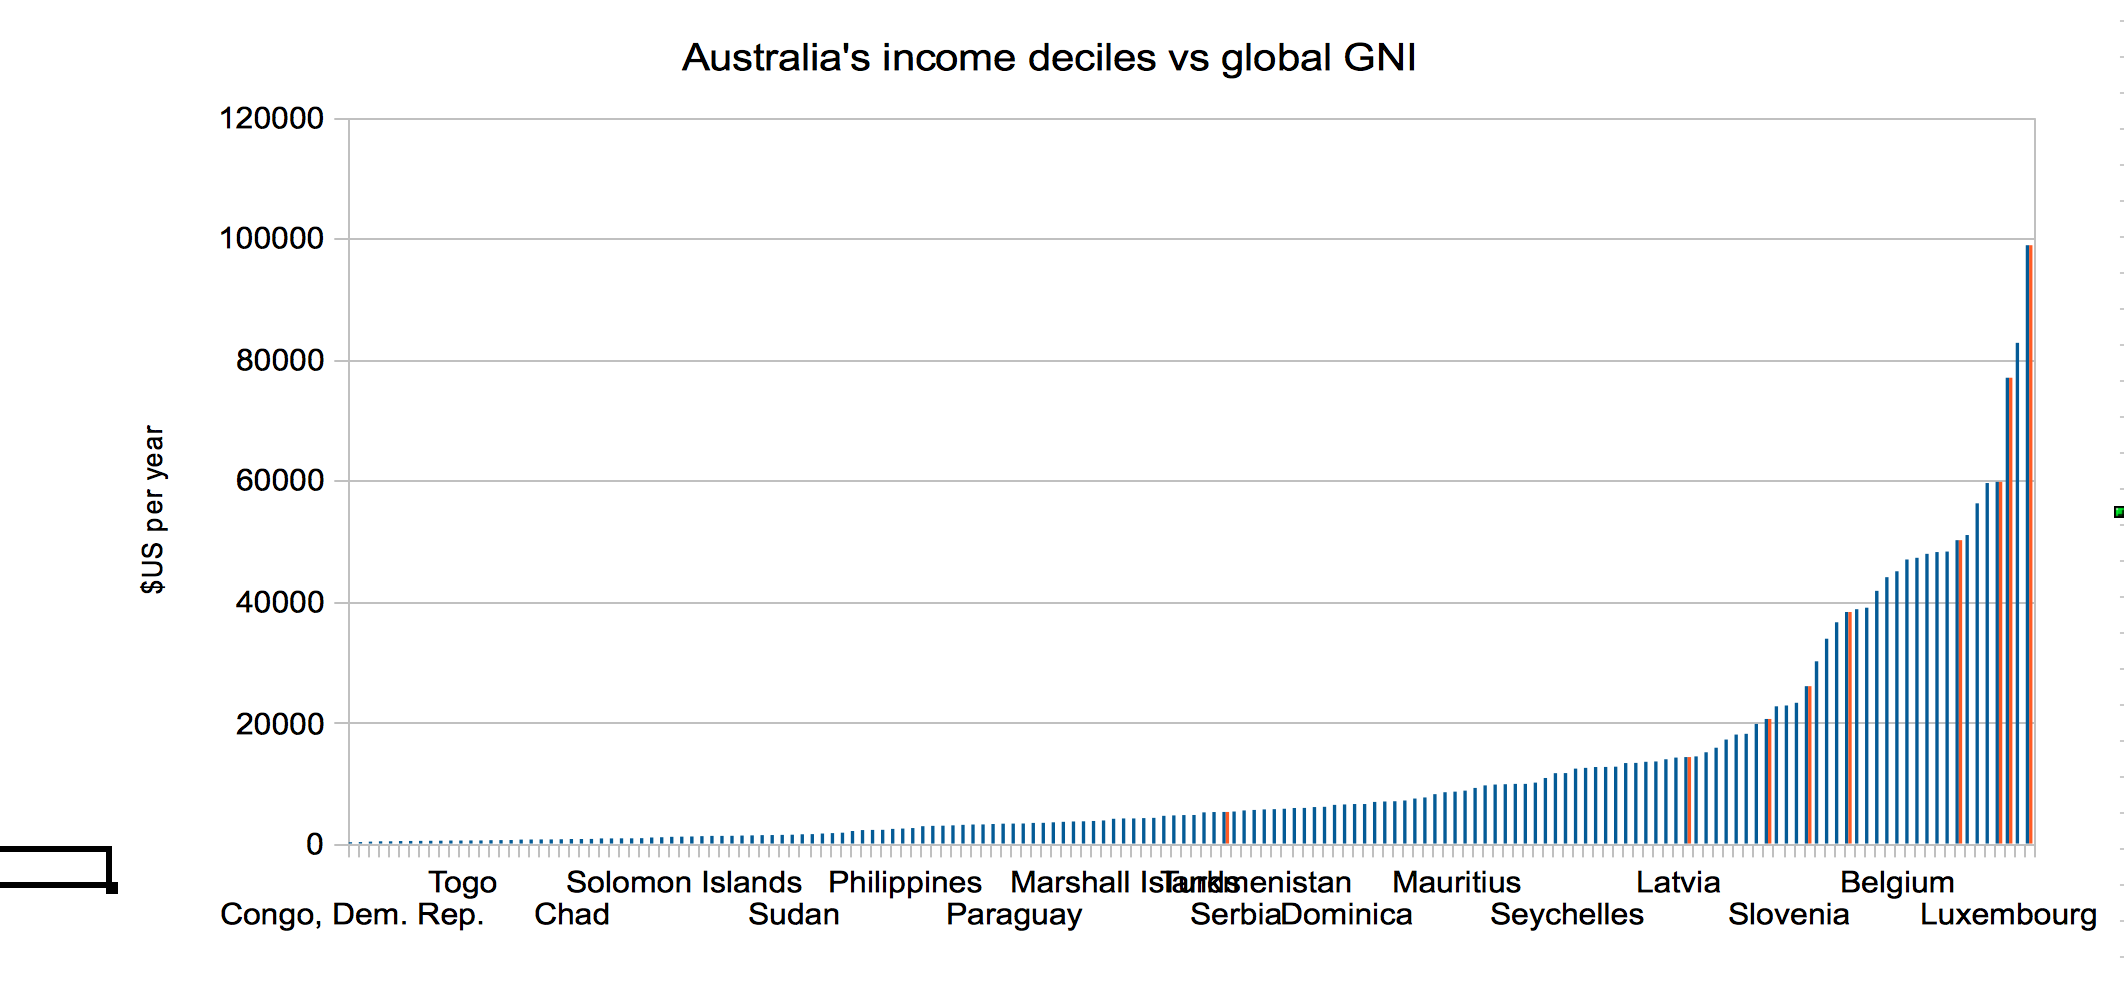
Lets’s zoom in on those red lines and see how Australia’s income deciles compare. [I am comparing ABS personal income decile data to World Bank per capita GNI data and all figures are USD]
More income than 10 per cent of the population ($4,580 / year):

EQUIVALENT TO PER CAPITA INCOME IN ANGOLA
More income than 20 per cent of the population ($14,800 / year):

EQUIVALENT TO PER CAPITA INCOME IN CHILE
More income than 30 per cent of the population: ($20,571 / year):

EQUIVALENT TO PER CAPITA INCOME IN PORTUGAL
More income than 40 per cent of the population: ($27,943 / year):

EQUIVALENT TO PER CAPITA INCOME IN CYPRUS
More income than 50 per cent of the population: ($38,286 / year):

EQUIVALENT TO PER CAPITA INCOME IN UK
More income than 60 per cent of the population ($49,257 / year):

EQUIVALENT TO PER CAPITA INCOME IN USA
More income than 70 per cent of the population ($60,229 / year):

EQUIVALENT TO PER CAPITA INCOME IN DENMARK
More income than 80 per cent of the population ($76,686 / year):

EQUIVALENT TO PER CAPITA INCOME IN LUXEMBOURG
More income than 90 per cent of the population: ($104,286 / year):

GREATER THAN PER CAPITA INCOME IN NORWAY
These are rough guides only. It doesn’t account for purchasing power, or household income, which is really important. Neither does it mention wealth.
But it makes one thing clear: Australia is a lot better off than almost all the rest of the world.
Some people in Australia’s bottom income decile would be part time workers and students who have household members to support them. In Angola, people are raising whole families on that income.
What’s notable is how when you’re off the bottom two deciles, the list is full of countries you’d call developed, first-world countries.
As the polity considers how to take Australia forward: such as who should pay as we reform the tax system? How much can we afford to spend on infrastructure? Can we afford disability insurance, etc. it’s important we don’t allow ourselves to be tricked into thinking we can’t afford to make changes. We are in a uniquely privileged position.

Top marginal tax was paid at $60,000 pa and over, at a rate of 48.5 % inc Medicare levy, in the early to mid 2000s.
Now $180,000 is the cut in, and rates are lower.
Difficulty in funding education, defence, etc., springs from over generous tax cuts as governments bought votes.
Solution: raise taxes on higher incomes slowly but inexorably, to squeeze the wealthy gently and not affect the poor. Then improved infrastructure, education and health could begin to drive the economy as a whole..
LikeLike