Roundabouts are good way to control traffic. But they are land-hungry. In certain places getting that land back should be a priority.
Land use is a topic that excites a lot of economists. We are obsessed with efficient use of inputs, and land is one of the trickiest ones to manage. Once some land is used in a certain way it can be used like that for years, or even centuries. This is path dependency in its original form – street patterns in some big cities were laid down thousands of years ago. Land use is growing even more important because we’re not making any more of it and density is growing
I believe I’ve got an idea for winning back some vital bits of land. To introduce the idea I want to show you a particular roundabout not so far from my house. It’s on a lightly trafficked road, it is very big and it’s on very desirable land.
What they need to do is join the land that is inside that roundabout to the waterfront. As it is, that land is cut off. It’s nice for birds maybe. But people can’t easily use it.
The view from there is amazing. it’d be a perfect picnic spot. There’s yachts in the foreground and the city skyline in the background. Highly Instagrammable!
Seems crazy to pave this spot
This idea flows from the principle that public space needs to be a certain size to be valuable to people. Little strips of grass or footpath next to a road are fine as buffers but not no good to sit in. a park or plaza needs to be a certain size to be nice to use. Pocket parks are nice ideas but they are often too pokey to be genuinely useful.
Here’s a graph showing what I mean. It has distance from the road on the x-axis and pleasantness on the y-axis. Note the horizontal axis is non-linear and I argue that a park can be too big in an urban setting – once you’re too far from a road the amount of passing pedestrians falls and a park can become empty and eerie.
This is just a model of how people enjoy public space. For different people and different types of road, the shape of the curve is different Still, if the idea embodied here is true it implies that by joining together bits of public space we can make them more valuable.
Here’s how I imagine the solution looking in Willliamstown. The new roads are outlined in red. The land in the roundabout is connected to the park. You could put in a micro roundabout at the new intersection or a stop sign. The road to the south side is just a driveway into the yacht club so it won’t be too busy (the busier the road the further you’d need to be from it to enjoy your surroundings)
To get value out of this idea it makes sense to move that carpark too, turn it into parkland
People would picnic at the feet of the cenotaph and it wold be beautiful.
Creating one big chunk of park out of two little bits of park could let us wring more value from the precious limited amount of land around. Back in the day such an idea may not have been valuable because the city was less crowded and land was less precious. You could seal off a big chunk of land inside a roundabout and it didn’t matter. Now that’s no longer true. We need to treat land like we treat water and stop letting it go to waste.
There’s another roundabout I would like to point out as well where this principle could help inspire better land use. It’s much smaller and in a less idyllic setting, but it is a crowded pedestrian area with very small footpaths. There’s a cafe there with outside tables that would benefit from much more footpath space. The site on the other side was a pub and could become an even more succesful one if there was space for a few outside tables.
Clifton Hill, about 50 metres east of the train station.
This is an extremely low traffic area and it wouldn’t risk creating a traffic jam if this roundabout became a narrow tricky thing drivers had to slow dramatically for. They could close off one of the exits or entries or perhaps create a hybrid roundabout / one-way slow point.
These are just two sites where land is at a premium and a legacy roundabout is gobbling up land that could be better used. I bet there are hundreds more like it across Melbourne and many thousands worldwide. And it’s part of the larger principle that we allocate a lot of land to roads that, in some areas, could be available for pedestrians and public use, and we should be fighting to win that back.
Everyone’s excited about this chart. It shows official interest rates racing up to over 2.5 per cent by the end of the year. That would be one of the fastest interest rate rise cycles in history and would make a lot of people with mortgages rather unhappy.
Each blue column corresponds to one of the next 18 months. The height of the blue column is how high official interest rates are expected to be in that month. (You can also see that value at the bottom of the chart in the row labelled “Implied Yield”)
The chart is not one person’s prediction. Instead it uses the wisdom of crowds: the values are derived from market prices in the Interbank Cash Rate Futures market. This market has a very good recent history of prediction. Back in 2021, It was insisting rate rises were coming in 2022 when the RBA was insisting the opposite and reassuring us they wouldn’t arrive until 2023-2024. But how accurate are these predictions more generally? Where do they come from? What assumptions do they make? I did some digging.
First I contacted the ASX, who publish the above chart each afternoon. I asked them: Who trades this market? The market for Interbank Cash Rate Futures, they told me, is on the ASX24 platform, which is traded around the clock by a small number of big name brokers and investment banks – Goldman Sachs, and their ilk – who have to register. The registered users provide access to their clients, being super funds, hedge funds, etc.
Plenty of people told me they thought rates would never get as high as the predictions above and would like to bet against them by trading in this market. Inquiring minds wanted to know: Can retail traders get involved in the market for Interbank cash rate futures? The answer is there could well be retail traders – the identity of who is trading through the big brokers and banks is anonymous. Minimum contract size for interbank futures is $3 million, but on closer inspection that seems to be the face value of the arbitrary contract – when trading it you’re only up for the interest on a contract of that size: A few thousand dollars. So it seems anyone can play if they have a broker.
The ASX also told me you can see prices here with a 20 minute delay.
The big question: Does this market really give us the best guess of the cash rate? This chart, from ANZ, seems to show the interbank futures generating a systemic overestimate of the eventual cash rate. There is much more grey line above the orange line than below, especially for the predictions made about later months in each forecast (each grey line is 17 or 18 months long and they almost all seem to bend back up). Is that for some technical reason? Or just because in the 12-year period depicted nobody could quite believe interest rates would not turn around and “normalise”?
Obviously predictions of the later future are more affected by random error. But even when the grey lines slope down at the start, they slope up at the end. Hmm. I found a 2012 RBA paper by Olivan and Finlay – Extracting Information from Financial Market Instruments – that made me worry later months are biased upwards:
“… the forward curve gives the interest rate agreed today for overnight borrowing at a date in the future. The forward curve can be used as an indicator of the path of expected future cash rates, but importantly it becomes less reliable as the tenor lengthens because of the existence of various risk premia, for example term premia. No attempt is made in this article to adjust for these risk premia and so they will affect the estimated zero-coupon curves.”
The RBA and I corresponded and Finlay confirmed there’s probably upward bias in the interbank futures market, but how much, you could never say.
…on average you would expect term premia to be positive (and so bias up the market rate relative to expectations) and to get bigger as the time horizon lengthens. BUT as said it is hard to be absolutely sure – term premia are unobservable and can in theory also be negative.
You can estimate models to separate term premia from expectations, but you need to make a lot of (possibly implausible) assumptions, so again need to take results with some caution.
Other futures traders assured me that over 18 months term premium is not worth worrying about. Does a possible bias in the later months matter a lot right now? No. If you glance back up at the first chart in this post, you will see that the steep part of the curve is in the next 7 months, not the following 11 months. It means this: the signal the market is sending could be wrong, but ignore it at your peril.
I did more digging around in the Interbank Cash Rate futures market, and found something probably more concerning than term premium: the later months are not traded very much at all. But their price appears to update even on days when none changed hands. Quite how this works is not clear to me yet.
There’s another problem with it too: Data on the Interbank cash rate futures market is hard to find. There is no publicly available repository of historical data that I know of (ANZ obviously has it, to make that chart above, but they are not sharing!) The ASX publishes a .pdf of one day’s data every day but when the pdf updates the previous day’s data is lost forever. They also go to the trouble of making it a low-resolution image so it’s hard to collect. Ctrl+c, Ctrl+v is out of the question. You’re either transcribing it manually or using optical character recognition. Thanks, guys.
WHAT ELSE IS THERE?
Interbank futures are not the only kind of futures product you can use to predict the future of interest rates. Another is called overnight indexed swaps (OIS) (aka overnight index swaps, both terms seem to be in use.) These are a bigger and more liquid market. They can trade differently to the interbank futures, directly between parties, rather than on an exchange. That would mean we don’t have data on them. However ever since the 2008 global financial crisis, governments like to keep an eye on derivatives like OIS, so (at least some of) the trades clear through a clearing house which collects data and provides it to government.
Historical OIS data is free from the RBA so long as you want to look only 6 months in the future. (But longer data must be out there somewhere- the big London clearing house LCH will clear Australian OIS with maturities of up to 31 years!) The following chart shows two different OIS prices, which contain information on predictions of the official cash rate in one and six months time. The data shows an expectation for six months in the future (i.e November) of rates at 1.42%. That’s gone dramatically higher in the last month or two as expected, but it is also a dramatically lower prediction than the Interbank Futures market’s prediction of 2.77 per cent! Why? This confused me for a while
The reason it is lower than the other chart turns out to be that the OIS pricing is an average of the cash rate over the future period, rather than the value of the cash rate at the end of the period. You can, however, do some maths on the value and derive the value at the end of the period, called the “forward” rate. The RBA helpfully provides this in table F17. You can see the OIS forwards compared to the Interbank futures in the next chart. They’re similar but not identical!
OIS forwards are the market pricing the RBA “typically” uses as an input to their forecasts. Does their use of it suggest the OIS forwards might be more reliable? Have we finally found the one optimal prediction we should rely on? Here’s an interesting wrinkle: The RBA governor recently said they now blend this series with economists predictions.
I can confirm that we’ve used the same assumption as last time, an average of the market path and the economists’ path. And just to be specific about that, we’re assuming in preparing these forecasts that the interest rate by the end of the year is between 1½ and 1¾ per cent. And then by the end of next year at 2½ per cent. So that’s a technical forecasting assumption.
That is new!
The RBA started averaging market data with economist predictions only recently. That approach has been used in the last two Statements on Monetary Policy. They previously used pure market pricing in their forecasts. Why the change?
My first instinct is the change came because the path of interest rates predicted by the market is now terrifyingly steep and when they feed that into the models we are a good chance of going into recession. Is that possible? The next chart shows the OIS-derived forecasts published by the RBA in May 2022. It tells us, yep, the RBA’s assumptions (e.g 2.5% at end-2023) are now well below the market predictions (3.5% at end-2023).
So most likely they were forced to abandon market pricing as an input to their forecasts because it made the forecasts look terrible!
Should we be worried about the sudden desire to dilute strong market forecasts with watery economist forecasts? Maybe. The economists are likely using similar methods to the RBA – and many bank economists are ex-RBA analysts – so the amount of truly independent information feeding into the RBA’s forecast is now much lower. Two downsides for transparency in all this:
These economist predictions are not easily available. I believe they are available on the Bloomberg terminal – I remember seeing them when I used to have access to that. However it costs US$24,000 per year to subscribe (this is why Michael Bloomberg is a multi-billionaire.)
The RBA hasn’t explained why they suddenly changed methodology (or at least I have not seen an explanation) opening up space for the type of speculation seen above.
Here’s an important question: Are the OIS forecasts usually an overestimate? Could that that justify the RBA’s choice? It’s a hard question, as the next chart shows. Mostly they overshoot, sometimes they undershoot, it is possible they have a bias to predicting a return to the status quo.
If we zoom in on the last hike cycle though we see that some of the predictions made at the start of that hiking cycle (the palest blue ones) were pretty accurate, at least for the first 12 months or so. Given this, maybe skepticism of the RBA’s changed approach is warranted? Maybe rates are going to shoot up more than they think?
Of course the RBA is not at the mercy of the futures market. Official rates don’t move by themselves: the RBA makes the decisions to lift them. The central bank’s choice to not use pure market pricing in its forecasts tells us it doesn’t expect to follow that path. So what we might infer from the steepness of the cash rate futures curve and the RBA’s desire to tread a less steep path?
Perhaps that the market is wrong about what it will take to control inflation? That would be good news. Or perhaps that the RBA realises it will have to let inflation run high for quite a while to avoid recession? That would be very bad news indeed. It’s worth watching these forecasts very closely, keeping an eye on inflation both here and overseas, and watching the RBA to see which way this tension resolves.
There’s one remaining mystery in all this: Why the difference in price between the two markets for cash rate futures, Interbank and OIS? And is the difference big enough for a clever blog reader to make money by aribtraging it? Let me know!
Thanks for reading this series. Your reward for getting this far is a juicy post full of fun stuff you can use to get an edge in the lottery. I didn’t expect it was possible to play the lottery strategically, but I was wrong.
I’m excited by what I found. Some numbers will give you an edge. I’ve never seen this analysis done before and I’m not sure why. I guess anyone else who does it keeps it to themselves!
My first post explained how we fail to recognise that other people will share our lottery win, and how that ruins everything. In that post I made a simplifying assumption that the numbers people choose were all random. If we all chose random numbers, then the risk of sharing the lottery win is affected only by the number of people who enter the lottery.
But that’s not the case. Yes, the numbers drawn by the system during the Powerball draw are random. But the numbers chosen by players when they buy their tickets? They may not be random. In fact, with online purchasing, choosing your own numbers is easier than before. No need for a pencil. All our superstitions and dumb heuristics are in play here, we just need to get the data to find how they affect our number choices.
Without further ado, let’s get to the good stuff!
Note that in the title of this post I say “edge”, not “chances”. That’s deliberate. I’m not able to change your odds. Your odds of winning are given by the number of balls in the system. But I can help you change something else that matters – the amount you win if your number is drawn.
As we explained in Post One,expected value is your odds multiplied by the amount you can win. This post is about how to improve your expected value. You do so by choosing a Powerball number that other people aren’t choosing. Ones on the left of the graph above. Unpopular numbers. That means you share the prize pool with fewer other winners and take home more lucre. You can’t improve expected value by much, mind you, but you might as well lift it as high as you can!
Think of this like harm minimisation for your lottery addiction. Most of the time, playing the lottery is the financial equivalent of shooting crack cocaine into your eyeball. It’s not financially healthy. In this metaphor, this post is like making sure you’ve got a clean syringe. If I can’t stop you doing it, maybe I can help you find a way to reduce the worst of the harm.
Lucky for some…
Before we go any further, a little bit of terminology. This post is about the Powerball number. Powerball is the name of the lottery, but also the name of one of the eight balls drawn in the lottery. Seven balls are drawn from a set labelled 1 to 35, then the Powerball is drawn from a different set, numbered 1 to 20. I’m going to show you the right Powerball number to choose. It makes a difference! In a later post we will look at the other seven numbers.
CHANNEL YOUR INNER TODDLER: YOU DON’T WANT TO SHARE
Choosing lonely, unloved numbers matters. Consider this story: A friend of a friend won Division Two in the British lottery. They expected hundreds of thousands of pounds, but only won thousands. They’d chosen their lottery numbers by going diagonally across the slip. That strategy proved to be surprisingly popular, meaning when those numbers came up there were a surprisingly large number of winners, all surprisingly crestfallen.
Let’s look at the key chart again, before we try to infer some lessons about what makes a number popular or unpopular.
WHAT IS SO SPECIAL ABOUT NINE? WHY ARE WE CHOOSING THESE NUMBERS?
Here are the numbers from least popular (1) to most popular (9). What does this says about the rules and biases people have when choosing lottery numbers?
I’m intrigued by the way the most popular four numbers are close to the middle of the range 1 to 20. It’s like people are using an understandable but silly heuristic – trying to minimise the size of their miss. They choose a number close to the middle. That way whether the Powerball is 5 or 15, they can say, Oooh, Close. (But not right in the middle, that doesn’t seem random enough! 10 is not popular.)
Small numbers are also out of favour relative to larger ones. The ten most popular numbers sum to 125 while the least popular ten sum to 75. Do larger numbers seem more “random” by virtue of being less familiar. And do we think more random-seeming numbers are more likely to be chosen by a random process? The human brain is a funny thing.
It’s also surprising to see 13 relatively popular and 8 lower down. This result makes me think people are actually already trying to use a version of this strategy – choosing unpopular numbers and avoiding popular ones. But absent data, Powerball players are all crowding into the same idea and negating its value!
The calculation is simple. Compare the number of winners in divisions that need the Powerball to the number of winners in divisions that don’t.
Divisions 2, 4 and 7 don’t require the Powerball to win. They provide our baseline. On any given week, if there are many winners in Divisions that don’t need the Powerball to win, but few winners in the Divisions that do need the Powerball, that might be a signal that the Powerball drawn that week was not a popular choice for players. And vice-versa.
Popular Powerballs create split prizes. For example, last week’s draw. The Powerball was Thirteen(13), a top-four popular choice. Despite a moderate number of entries, the $10 million Division One prize was split two ways, with each winner getting $5 million. Pretty crummy luck for the two winners!
There’s a lot of random variation in number choices (many people get a ticket type called a “quickpick” where the computer spits out random numbers) so we need a good sample size to have confidence in these estimates, but the maths here is not hard: No French polymaths required!
Technical note: Please consider the above graph as a ranking of popularity. I did some normalising and the y-axis does not represent absolute popularity of the numbers.
THE WHOLE NINE YARDS
The chart above is nice because solves a nagging mystery for me: back in 2019, the biggest Powerball Division One prize in history was split three ways. My calculations in Post One argued that week was the only Powerball draw in history with positive expected value, based on the number of entries. The chances of splitting the $150 million Division One prize were modest, I thought, but it was actually split three ways. Three people had the same winning numbers. Perhaps the Powerball that Thursday made a difference? It was Nine(9), the top choice.
If that week the Powerball drawn had been One(1), perhaps Division One would have jackpotted to an even bigger record!
WILL USING THIS STRATEGY PAY OFF?
I got the above numbers by maths. The real-world test is if they are associated with higher prizes. So I checked to see if the bottom three least popular numbers were associated with bigger wins.
The answer appears to be yes! The next graph shows a juicy bonus in Division 9 from choosing the least popular numbers (1,2,16) compared to the most popular ones (7,12,9).
Remember from post one that Division Nine gives you a huge chunk of your expected value. Increasing your prize by even a little bit helps.
Division 9 results 2018-2022. Vertical line is mean of prizes awarded
The same kind of result is seen for the other Divisions that require the Powerball (with the exception of Division One, because when there are fewer winners in Division One that usually means the number of winners goes to zero and the prize goes down to zero too.)
PARTITIONING
However, here we run into a question of good statistical practice. I formed the hypothesis by exploiting a dataset of Powerball draws between 2018 and now. If I test the hypothesis on the same dataset, there’s a risk I am fooling myself – random variation could be presenting itself in a way that looks like proof!
I need to test the theory on another dataset. Lucky for us, I have all the results from the old Powerball draws between 2013 and 2018. What sort of results do we see if we test the same popular and unpopular numbers?
The result is pleasing. Again the numbers that were unpopular in 2018-2022 are associated with higher prizes.
Does that mean the exact same numbers were popular and unpopular back then? If we run the same analysis of most and least unpopular numbers on that old dataset we can answer the question.
The answer is: not exactly. Some numbers appear more popular in the older dataset, some appear less popular. Nine(9) is a big mover, going from top to bottom half of the popularity charts. Perhaps people change strategy over time? I think a more likely scenario is statistical noise. But importantly there is one consistency between the two lists, and it is the most important fact: The least popular number to choose as Powerball is One (1).
That matters because the least popular option for everyone else is your best option. You want to choose the Powerball the fewest other people have chosen, and the data makes it crystal clear what the best choice is. Choose One(1). Every time.
The next graph shows the size of the increase in prize you can expect if you choose One(1) as your Powerball. (Ignore Division One, it is confounded by the prize not going off. Division Two is also not relevant as you don’t need a Powerball to win it – the result there is statistical noise.) Look at Divisions Three, Five, Six, Eight and Nine. You can expect a higher prize if you chose One (1) as your Powerball. Fewer other winners are in the mix sharing your prize.
The result in Division Nine has the least statistical nose in it and so a 7 per cent uplift is our best estimate of the upside of choosing One(1) instead of Nine(9).
Let’s assume you choose to play Powerball next week. (You should NOT ! the prize has gone back down to a miserable $3 million and the expected value is so negative it makes the Russian Stock market look like a good idea.) If you must play, choose One (1) as your Powerball. Few other people will do so, and if it is drawn your winnings will be higher.
But what about in a year’s time? How long will this edge last? Possibly, just possibly, the word will get out. If you share this post with one other person, and they share it with one other person, then over time, it might become common knowledge that the best choice for the Powerball is One (1). And when that happens, everyone will be doing it! And if so the best response will be to change. This is the literal definition of a strategic game – your best move depends on what everyone else is doing!
But remember this: if most people were smart about playing Powerball, there would be no Powerball. The opportunity to get an edge should last for a while yet!
This is post three in my Powerball series. Post One is here, on Naivety. Post Two is here, on Profit. Post Four is coming soon. In that I will look into what numbers are best to choose for the other seven numbers, excluding the Powerball.
Last week Powerball rose to a very rare $120 million Division One jackpot, and I wrote a post about why such jackpots seem so tempting but turn out so frustrating. It turned into one of the most popular posts in the 13-year history of this blog and readers told me they loved it. I was delighted.
If you would like to read it the link is here. The spoiler is big jackpots are not so great because so many people buy tickets. Even if you win, you’ve got a bigger and bigger chance of sharing the jackpot with others.
I published my post on Tuesday and the draw was on Thursday night. It might have been a popular post but it had absolutely zero effect in dissuading ticket sales! In fact, Powerball managed to sell more tickets for last Thursday’s draw than they had ever sold for any draw before. I had a model that said they would sell 175 million tickets. Instead they sold 250 million tickets. The next graph shows how far out of the usual pattern it was.
We had very little data on how many tickets would be sold for such a large jackpot. Last week I was cautious about saying there might be a non-linear relationship between ticket sales and the jackpot size. Today I can say for sure. There is one. Imagine a straight line through those yellow dots – it would go nowhere near the red one. People go absolutely bananas for a big prize.
Because so many people bought tickets (far more tickets than there are unique combinations), two people held the same winning numbers. The prize was split with the two winners each taking home over $60 million. The prize pool was greater than the advertised $120 million because so many people bought tickets and Powerball is obliged by law to give back 60 per cent of takings, so they bumped up the Division One Prize Pool to $126 million.
The amount of revenue from the most recent draw is a record: $300 million. But as you can see in the next chart, the most recent draw was not the most profitable. It is usually the penultimate draw before the jackpot that makes the lottery company the most money.
You can also see from this chart that they do sometimes lose money on the big jackpots. In particular, four consecutive big jackpots in 2020 were money-losers. Ticket sales were no doubt disrupted at that point thanks to the pandemic and national lockdown. However, no draws since early 2020 have been money-losers. We will explain why in a second, but first lets talk about where the profits go.
The profits of Powerball look too good to be true, right? In a way that’s right. Tabcorp does not keep all the money. The government benefits in several ways. For example, state lottery taxes in the state of Victoria take 90 per cent of what is lost (tax is slightly lower if tickets attract GST). That leaves the lottery company with the sliver between the red and green lines . One reason not to feel bad about buying Powerball and losing is you help fund our health system!
The real money-making weeks for Lottery companies (and their regulators!) are the ones just before a jackpot goes off. When the Division One jackpot does not go off, profits rise in a simple, predictable and very steep line, as shown by the triangles in the next graph. Weeks when the Division One Prize goes off are much less profitable.
This is probably why Tabcorp is eager to make lotteries harder to win. The data I’m using for Powerball goes back to 2018. The reason I haven’t gone back further is because prior to that, Powerball had fewer balls to choose and fewer divisions to win. They changed the rules of the game in 2018, creating Division Nine – which was easier to win – while Division One became much harder to win. The intent was creating fewer Division One wins and more jackpots.
Tabcorp is now planning to do the same to Oz Lotto, which is, like Powerball, a jackpotting lottery. Unlike Powerball, Oz Lotto is drawn on Tuesday nights and has a yellow colour scheme instead of purple. They are very different.
“We will also introduce a change to Oz Lotto that is expected to create larger and more frequent jackpots in line with its promise to deliver ‘Big Aussie Fun’,”
Tabcorp boss David Attenborough, speaking last week. (No, not that David Attenborough!)
The changes will make Division 1 “more likely to jackpot (c.40% more combinations)” Tabcorp say in their recent investor presentation. (pdf at link).
Powerball is Tabcorp’s most popular lottery, so attempts to make Oz Lotto more similar make sense for them.
In fact, the popularity of Powerball has been surging over time. This may explain why draws have been so profitable recently – and also why so many people bought tickets last week. There are more powerball players now than previously. Tickets sold each week have risen a lot, and they rose especially during 2020. People were stuck home and bored and had, thanks to the various fiscal supports, money to burn.
If you buy Powerball tickets when the Jackpot is $3 million you are incinerating your money. Stop it!
The yellow lines go up, but then they seem to stall a bit. Hot demand for low levels of Powerball may have cooled in 2021-22, which is a tantalising explanation for why the jackpot rose so high recently. A climate with fewer ticket buyers lets the jackpot rise.
It’s a paradox that the more people pile in to the low levels of Powerball, (e.g. selling 45,000 tickets for a $20 million Division One prize pool instead of a mere 25,000 tickets) the lower the chance of the prize rising to a level where Powerball might sell 250 million tickets. And make no mistake, they like those long sequences of jackpots. Once they’ve made OzLotto harder to win, Tabcorp might be tempted to come back to Powerball and do the same thing to it.
Part Three is about Strategy. It is coming soon and concerns the burning question of whether you can do better by choosing numbers other people aren’t choosing (yes you can, and I will demonstrate a way to work out what those numbers are. )
POST STATUS: Lot of calculations below. Still early days in the checking process. Could be errors. Caveat emptor!
—
This Thursday’s Powerball has a $120 million Division 1 prize pool. It’s huge – the second biggest Division One prize in history. Over 175 million tickets will be sold, at a total cost of $213 million, equivalent to seven tickets for each living Australian.
But should we play? The answer might surprise you. There are three main levels of Powerball naivety, and then one bonus level.
DADS AND ODDS
I care about Powerball mostly because my dad plays it now and then. He’s an educated man with a successful career behind him, but likes the idea of a big prize.
The first thing to know is the odds of winning Division One with a single entry are small. Really really small, as the next chart shows. Division Nine, by contrast, is up for grabs.
Powerball is owned by Tabcorp and each week they lavish a lot of attention on the Division One prize, but it is not given away each week. Far from it.
DIVISION ONE DROUGHT
The last six draws have all gone by without a Division One winner. Such streaks are not uncommon. Around three-in-four draws end without anyone winning Division One and so the big prize is won roughly once a month:
Division One was won:
10 times in 2019,
14 times in 2020, and
13 times since the start of 2021.
The next chart shows grey lines when the Division One prize was not won, and jackpotted to the next week.
This matters, because the prizes underneath Division 1 are nothing to write home about. Division 9, which you have a one-in-66 chance of winning, averages just a smidge over $10. As the next chart shows, even Division 2, which you have just one chance in seven million of winning, regularly pays out a middling $100,000. Often even less. Most of these other prizes are simply not worth getting excited about.
It’s all about Division One.
The jackpot structure of Powerball makes each week different. Which got me thinking. Maybe, just maybe, Powerball could sometimes have positive expected value. Right? They do a bunch of draws where the Division 1 prize doesn’t go off. Those must have been very profitable. Perhaps that’s how they make their money? And if the prize builds up high enough, to a high jackpot, those weeks could have positive expected value for a player. Maybe, if you played only in certain circumstances, you can expect to come out ahead, on average?
EASY VICTORIES: KNOW YOUR EV.
We need here a very brief introduction to the concept of Expected Value, which I will call EV. It’s a tremendously useful concept, and a simple one: Your expected payoff is the chance of winning multiplied by the payoff. And the expected value is the expected payoff minus the cost.
For example, if you give me a $2 prize for calling a coin toss correctly my expected payoff is $1. If you charge me $1 a try, my expected value is zero. If you lift the prize to $2.10 , my expected value turns positive.
Knowing EVs is really powerful: They tell you what to do. If an EV is positive, you should play that game or do that thing as much as possible. If they are negative, you should run away.
You have a negative EV if you play roulette at the casino. At Roulette, the combination of the chance of winning and the prizes are designed to give the player a negative EV and the casino a positive EV. It’s a great game for them, in the long run, and a terrible game for us. If you repeatedly play games with negative EVs you will end up losing big.
The EV concept is applicable to real-life situations too, not just games. Investing well depends on estimating EVs, for example, and different postgraduate degrees might have different EVs too. You can extend expected value to any domain where chance or uncertainty is present.
For us, the EV is the main thing we need to know to decide whether to play Powerball. (Assuming, for now, you don’t just love the anticipation of holding a ticket in your hand and setting your mind free to dream).
GETTING RICH ON THE LOTTERY?
How do we figure out the expected payoff of a Powerball draw? Let’s look at the smallest draw this year, with a $3 million Division One prize. For a rough estimate we can simply multiply the odds of winning each division by the prize. The next chart shows the results of that calculation.
As you can see, Division 9 is doing most of the heavy lifting here. Your one-in-66 chance of getting back around $10.20 is worth a little over 15 cents. The one-in-134 million chance of winning $3 million is worth only 2.2 cents!
After you subtract the $1.21 cost of entry the EV is very very negative. You definitely shouldn’t play for such a small jackpot.
WHAT ABOUT THE BIG PRIZES?
With a bigger Division 1 Prize, maybe your EV goes up? Sure does. Once again we use a simplified technique – multiplying the chance of winning by the advertised prize. Lo and behold, the higher the prize the bigger the expected payoff.
This is a potentially exciting graph if you’re not careful.
Because the next draw, this Thursday, has a Division One prize of $120 million. That would seem to change things. A one-in-134-million chance of winning $120 million is worth 89.5 cents for Division One alone. The lower divisions are consistently worth about 40 cents of expected payoff. Add those to the 89.5 cents and you have an expected payoff of $1.30 – higher than the cost of the ticket! The EV looks to be positive.
“IS IT WORTH PLAYING THIS WEEK?!”
A few years ago I found myself asking this exact question about a Powerball draw with a big Division One prize. My back of the envelope calculation told me the EV was positive and I should play.
What I soon learned is if multiple people win Division 1, they split the prize. Your odds of getting a winning ticket are the same, but if you share it, your payoff is split. As the next chart shows, Division One has gone off 34 times in the last few years, and it has been shared between multiple winners on 4 occasions.
Here’s the problem:
The number of tickets sold rises as the Division One jackpot rises. And the higher the number of tickets sold, the more chance of multiple division one winners.
You can see the effect in the chart above – three of the seven largest Division One prizes had multiple winners. So the simple calculation I was using above – chance of winning multiplied by advertised prize – is misleading. It’s wrong.
It doesn’t take into account the risk someone else out there has the same winning numbers, is there for your giant cheque ceremony, steals your limelight, splits your pot and rains on your parade.
Check out the $150 million prize in 2019. You think you’re playing for $150 million – the good people at Powerball HQ encourage you to think that – but as lightning strikes and the one-in-134-million chance you have the winning numbers becomes reality, you also discover your lusted-after prize is actually a mere $50 million. (Sure, $50 million is nice, but it’s no $150 million, is it?)
THE THRILL
This is the point that got me really excited: I wanted to quantify this. If there is a relationship between advertised Division One prize and the number of tickets sold, and a relationship between tickets sold and the odds of multiple winners, could we therefore calculate a more realistic EV for each draw? I wanted to do this ever since the $150 million jackpot back in 2019, but it was only this year – once I learned to use R – that doing so became possible.
I scraped data from the internet that let me calculate the number of entries in every Powerball draw in the last 20 years. Here’s data from the last four years, showing that entries rise dramatically when the Division 1 jackpot rises. The red line is a model of a linear relationship.
Is that red line satisfying? Not really. Might the relationship be non-linear? Maybe! The yellow line in the next graph is a smoothed version of the points.
Your chances of splitting Division One go up and up the more people enter. And that changes everything.
THE THREE LEVELS OF NAIVETE
There’s three main levels of Powerball naivety here.
One is not realising the pot can be split if multiple people have the winning numbers.
The second is not realising the positive relationship between tickets sold and Div 1 prize: Just because multiple winners are rare, doesn’t mean they won’t happen for the big prizes!
The third one is not recognising that the relationship is non-linear, so your chance of splitting the prize is rising most dramatically when the jackpot is highest .
This latter point is important. Powerball draws with Division One prizes below $110 million can’t possibly have a positive EV. The odds are too bad and the prizes are too low. But draws with high Division 1 prizes – such as this week – could in theory have positive EV. The bend in that yellow line may be helping prevent that theory from becoming reality.
DOING THE MATHS
The maths here were tricker than I first realised – I only solved it after cracking out the Poisson distribution. The odds of winning Division One are low. But enough Australians buy Powerball tickets that when the prize gets big, there’s a strong chance of multiple winners.
This graph shows exactly that. Pay attention to the falling white line – that’s the odds of nobody winning the jackpot, and it dips below 50% when the jackpot is around 80 million. When the Division One Prize is just over 100 million, the odds of there being one – and only one – winner peak. After that they are falling. Somewhere north of $150 million the odds of there being 2 winners will be greater than the odds of 1 winner.
This chart also reveals that the $150 million Division One prize pool from 2019 that was split by three people was actually a little unusual. The odds of there being three or more winners that day was only a little over 20 per cent. It was actually more likely to jackpot than be split by three people. Just a good reminder that the odds aren’t everything!
Just for fun, here’s the odds of multiple winners in Division 2. I include this graph because it shows even more clearly how the chance of a division having a small number of winners dissipates when the prize gets high. (And also because it looks cool and swoopy.)
Your odds of getting the winning number don’t change when there are multiple entries. But your expected payoff from getting the winning number does change.
As more people enter the lottery, your EV must fall. This is not the kind of lottery where you can trust your instinct (and this is perhaps the most important reason for this blog post – to help people overcome that instinct!).
FATAL INSTINCT
The way entries rise with the Div One prize pool suggests some people may be taking that instinctive, naïve view. The higher the jackpot, the more this matters – the more the naïve view takes you further and further from the reality. This week, for example, with the high prize, knowing you may split the pot is more important than ever. The expected number of winners is 1.3, meaning a hefty chance someone else will have their mitts on your novelty cheque.
I set out to calculate the true EVs given the odds of sharing the prize.
I spent ages hoping the highest EV would be for a Division 1 prize that was not a record high, rather than the highest one. I wondered if there was a tipping point where so many people entered the lottery that despite the higher jackpot you had extra reason to stay away. Perhaps the sweet spot with the least-negative EV would be $120m or so. That would have been a cool, counter-intuitive result!
But no, the dominant factor in the EV remains the Division One prize (at least at the prize levels we have seen offered so far). As you can see in the next graph, the $150 million prize back in 2019 (orange bar) is the one with the highest expected value.
Notice something? Even accounting for the chance of multiple winners, that $150 million draw had positive EV!
So here’s the final bonus level of Powerball naivete: scorning lotteries altogether. It’s a good reminder to keep an open mind. If this week’s Powerball jackpots (probability of there being no winner is ~ 27%) next week could (maybe, just, barely) be worth playing.
HOW MUCH DIFFERENCE DOES IT MAKE TO ACCOUNT FOR MULTIPLE WINNERS?
At the lower jackpot levels, not much. The gap between the naïve EV (simply multiplying the odds by the advertised prize) and the true EV is highest for the bigger jackpots. Which may be why many people respond so strongly to higher jackpots – they are using a naïve estimate of their EV, failing to realise – as I once did – that the prize can be split.
This next chart shows how the naive EV and true EV diverge:
For this Thursday’s draw, we can expect 175,000,000 entries, some of whom may naively suspect their EV is higher than the ticket price. But actually it is lower, because the expected number of Division One winners is 1.3. That eats away at the Division One prize you can expect to take home.
WHO WANTS A JACKPOT?
The lottery company really wants the prize to jackpot. Not just because their profit on this week’s Powerball draw is $120 million higher if the prize does not go off! After all, they do need to send that prize on to next week. What they crave is the free word of mouth that comes with an even bigger jackpot next week.
I guarantee there will be Powerball mania next week if this week’s draw jackpots and they can offer the biggest prize in history. It will be on the news, people will be whispering about it at the watercooler, and newsagents will have their first reason to smile in years.
I also hope this Thursday’s Powerball jackpots. Because then we can collect more data on the number of tickets sold when there is a $150 million+ prize! There has only been one in history and I’d like a bigger sample.
Could it jackpot twice more? The chance of a $150 million prize jackpotting is so low it hasn’t happened before. There have only ever been three draws with a Division One prize over $100 million and they have all been won. We don’t even know what the prize level above $150 million would be. $200 million? $180 million? Something else?!
WHAT YOU SHOULD DO NOW:
I remember one drunken night at a Chinese restaurant being cajoled to join a Powerball syndicate for a huge jackpot. The memories of the details are dim but the memory of the excitement is vivid. We didn’t win though. I think people get genuinely revved up when powerball ticks over $100m, and they go buy tickets.
If your mates are trying to convince you to join them in buying a ticket this week – and you don’t want to waste your money – please feel free to send them this post. “If we all hold off buying this week,” tell them, “the chance of a jackpot is higher! Let’s wait for next week…”
—
POSTSCRIPT. All this was done in R. R is the major source of my nightmares a free open-source coding language for doing statistics and making graphs (and a few other tricks).
I’m what they call “self-taught.” That term may sound cool but what it means is a huge number of people taught me, rather than just one. I owe massive debts to generous people whose advice and counsel I found on Stack Overflow, Twitter, Runapp, Youtube channels and blogs. Thank you. Errors are mine.
Code is posted on my Github. I’m still in beginner mode and very open to feedback on the code – please feel free to take a look and add yourself to the huge group of people who’ve helped me learn .
This entire series of posts rests on the claim we did. Yet memories of the Spanish Flu – also known as the Great Flu – exist. Obviously they do. The disease has a Wikipedia page. Science is still studying it – in 2018 a special Spanish Flu edition of the American Journal of Public Health came out, in honour of its 100-year anniversary. It even has a couple of references in pop culture. The book Pale Horse, Pale Rider, is about the ravages of the 1918 flu.
So how can we say that the flu – which killed as many as 50 million – was forgotten?
To answer this question, I got on Zoom with Professor Guy Beiner, historian and the pre-eminent global expert on forgetting. The conversation was a delight and I can tell you Beiner is an absolute treasure. Employed by the Ben-Gurion University of the Negev in Tel Aviv, (and perhaps the only owner-operator of an Irish accent in the neighbourhood) his specialties are three-fold: Irish history, memory, and the Spanish Flu.
Professor Beiner and his very nice Zoom background.
Northern Ireland turns out to be an excellent place to study forgetting, because a lot of protestant residents were part of a big rebellion against the British in 1798, but that aspect of their history is now not publicly mentioned.
But Beiner’s big focus when it comes to forgetting is the Spanish Flu. He is no recent devotee to the question. He tells a great story of meeting a publisher for drinks in New York in December 2019, and pitching a book on his life’s passion, the memory of the Spanish Flu.
“It sounds promising but will there be a readership for this?”, he recalls the publisher asking. “Three months later I get an email, ‘Why isn’t this book here already?!’”
Beiner likes to find the exceptions and the nuance. To make things complicated. This is how he started our chat:
“On the one hand it’s an easy case to make the case for the amnesia of the great flu. You’re in Australia, you’re in Melbourne, you have that massive ANZAC monument, pyramid-like structure [he means the Shrine!] … The huge culture of remembering ANZAC in Australia, compare that with the great flu, there’s nothing. You won’t find one monument to the great flu – or you look around you’ll find a couple, but you wont find any major monument… You won’t find any museums, you won’t find any remembrance day, you won’t even find the most banal thing! You won’t find one stamp commemorating the dead of the flu, right!? So if there’s collective memory, this is collective amnesia.”
The Shrine, Melbourne.
But then he complicates the narrative.
“I don’t like the term collective amnesia, it’s too easy… Memories had been there but they didn’t have the chance to surface.”
After wrestling with the way in which society deals with aspects of history, Beiner invented the concept of “social forgetting.” And social forgetting is not the same as private forgetting. Memories don’t die immediately, and that’s very good news.
Professor Beiner told me about a historian who puts ads in newspapers asking for stories of Spanish Flu, and laboriously visited people in their homes and recorded their stories one at a time.
“People remembered, they just needed to be asked,” Beiner said. In other words, the memories were there, like a great aquifer beneath the surface, but without public remembrance they lacked a well-spring, lacked a way out.
Incidentally, it occurred to me the historian mentioned would have saved a lot of time if he had the internet at his disposal. One could attempt a project of eliciting memories online at a fraction the effort. I gave it a go. My first shot looked like this.
Eleven thousand upvotes and over one thousand comments!
(Yes the two posts are basically identical in content – but not in form. Never underestimate the importance of re-writing to make an idea catch on!)
The volume of memories elicited by one Reddit post is impressive. The other notable thing is their level of detail. Primarily, these stories are bare outlines. One sentence or two. For example, “My great grandmother died of it, and my great grandfather remarried to her identical twin.”
Imagine the intensity and richness of that series of events. The scorching emotion and the familial repercussions. Yet what remains of the memory is skeletal. That’s how memory looks when it has decayed substantially. If we had asked for war stories, by contrast, it is likely far more richness of detail would be on offer.
There’s a lot of public war history out there to tap into. The Australian government, for example, maintains an enormous website to help people find the war records of their family members: https://discoveringanzacs.naa.gov.au/ It is an extremely impressive bit of infrastructure and well worth digging into if you’ve got ancestors who went to war.
No such system exists, it goes without saying, for archiving and preserving Spanish flu memories. The absence of flu memorials is not just an Australian oddity, it is systemic and global. Despite the millions of lives lost – more than were lost in world war one – it is not something we’ve set about remembering. At our great cost.
War memorials – they are everywhere.
WHAT IS COLLECTIVE MEMORY?
Memories are personal. They sit in the brain. But memory is not just about the endurance of sparks in the old grey matter.
The godfather of the concept of collective memory is a Frenchman named Maurice Halbwachs. One of those polymaths who seemed to crop up in Europe 100 years ago or so, Halbwachs had big contributions in statistics and philosophy but his most enduring intellectual legacy is the idea of collective memory.
Halbwachs followed Emile Durkheim in rejecting overly individualised accounts of how society works. His favourite hobby was to stir up the psychologists.
“ …one is rather astonished when reading psychological treatises that deal with memory to find that people are considered there as isolated beings,” writes Halbwachs.
His ground-breaking ability in statistics gave him unique insight into how social context affected individual outcomes. He could see the patterns in the numbers and took a great interest in the collective. When he began applying this collective approach to questions of memory, he was alert to the way society affects memory:
It is absolutely the case – even the psychologists agree these days – that memories must be retrieved to be refreshed. The more opportunities there are for retrieving memory, the longer the memory endures. ANZAC day and Armistice day and the thousands of war memorials around Australia help us keep the war(s) alive in our memories.
The past is partly buried, but it holds up the future
The lack of public memorialisation is vital to the forgetting of the Spanish Flu. Forgetting is baked in by a public realm that has until recently acted as if the Spanish Flu never happened. Our collective memory of it has for the last century been a pale and sickly thing.
(Halbwachs, by the way, was sent by the Nazis to Buchenwald concentration camp in 1944, at age 68, and died in there. We will come back to his legacy in a future post on memory and war.)
GOING PUBLIC
There’s an important caveat on the above discussion about private memory and social forgetting. Private memories can become public. The Reddit thread above is, it occurs to me now, an example. A thousand flu stories were just transformed from private to public.
It is absolutely no coincidence this is happening now, as covid viruses are tearing into lung tissue around the world.
Recurrence is major way old disasters are remembered. When a cyclone hits Mauritius, that’s when previous cyclones are discussed, for example. When a flood hits Brisbane, conversation turns to previous floods, and the TV channels show old footage, etc. Another example: According to Google Scholar, a disproportionate 17 per cent of all papers written about the Spanish Flu were authored in the last two years
One big thing that stopped Spanish Flu from being forgotten even more profoundly? The AIDS crisis in the 1980s. As Alfred Crosby writes in the introduction to the second edition of his book The Forgotten Pandemic, it sparked renewed interest, and book sales.
“For some of us, the malady recalled to memory what the Surgeon-General of the United States Army Victor Vaughan, had written about the peak of the 1918 pandemic: “At that moment I decided to never again prate about the great achievements of science.” – Alfred Crosby on AIDS
Crosby’s book came out in the 1970s, and sold very few copies. But it did have an impact.
“It starts the historiography of the flu,” Beiner says. “There were a few books before that, but after Crosby, that’s when historians start noticing the flu… It starts a trickle. Some PhDs begin appearing after Crosby, he’s a landmark in many ways.”
That was in the late 1970s. Crosby’s book was reissued by the publisher in the 1980s, and sold fast. The reason was AIDS. The pandemic created a newly receptive audience. The same happened again during SARS in 2003. New pandemics lifted public interest in the old, and what little material existed memorialising the Spanish Flu became of vital importance, bringing old private memories to the surface.
Whether things are remembered or forgotten is not static. Obviously individuals forget. But for society memory can move the other way. If we try – if we want to – we can remember things that are previously forgotten. We can reverse social forgetting of floods and storms, wars and even genocides, so long as the private memories remain alive. And doing public memorials will strengthen those private memories.
We can stop the process of social forgetting that Guy Beiner describes and make these memories vivid and relevant. And, importantly, heed their lessons. The world is doing that with the Spanish Flu right now, which is good, but might it be coming just a tiny bit late?!
That’s why this topic is so important. If we can learn how society forgets, how it errs, how it stumbles into the same traps again and again, we can – hopefully – start remembering before it’s too late.
How do we remember? Stories. Since forever. Long before TV. Long before books. Humanity is hard-wired to LOVE stories, and pay attention to them.
In recent history, one story stands out. An epic narrative that gripped the west, the English speaking world in particular. Including parts of the world that have, incidentally, done a terrible job of handling the pandemic. Game of Thrones.
George R R Martin has sold around 100 million copies of his book series A Song of Ice and Fire. The television adaptation – Game of Thrones – drew up to 20 million viewers. That’s for each episode, when it was shown live. Total viewership would be in the billions. This narrative had reach, it had impact, it was celebrated: The TV show won more Emmy awards than any TV drama ever and regularly tops the list of best TV shows of all time. In the decade preceding the pandemic, it was the dominant piece of popular culture.
So what does this very long story have at its heart? A forgotten disaster.
Now, why did we need this again?
The fictional world of A Game of Thrones is centered on Westeros, a land with a big wall at its north. A wall – 200 metres high – separates the kingdom from badlands beyond. The story opens “beyond the wall,” where we discover a terrifying enemy is rising. An invasion force this society faced before, but to which it now pays scant heed.
Has the society of Westeros been investing in its defences? Oh no it has not. Once upon a time the wall boasted an enormous force, no longer. The wall has nineteen fortresses and towers but these days only three are staffed. Furthermore, the recruits into the force – known as the Night’s Watch – are the dregs of society, supposedly criminals given the opportunity to join instead of being sentenced to death.
This is the set-up. Thousands of pages of gripping narrative ensue, dozens of hours of extremely expensive premium television, lovingly shot on location. And the tension that illuminates the whole damn thing is that of a pantomime:
The frustration where the crowd yells “He’s behind you!!” and the actor looks over the wrong shoulder? Not seeing the threat that is totally obvious? This iswhat powers the book series A Song of Ice and Fire and the TV series A Game of Thrones.
The kingdom of Westeros lavishes attention on power plays and assassinations – and gives thousands of lives to internecine wars – while vigorously ignoring desperate warnings that an existential threat is building.
Palace intrigue. Oooh Shiny!
The watchers on the wall are out of sight and out of mind for the decision makers, who live at the opposite end of the kingdom. Few powerful people have ever visited the wall. When one does, it is a surprise. That happens right at the start of the story, and notably the powerful person who makes that visit, (Tyrion Lannister, brother of the Queen) becomes a hero of the book.
The Night’s Watch use the surprise visit to make a request for additional help. Which is ignored. Its inability to raise much in the way of manpower is a consistent theme of the story. Even the organisation itself seems to have experienced strategic drift. It is now focused on repelling attacks by humans who live on the far side of the wall. The folly of this is apparent to the reader, but eventually, deep in the narrative, in book forty-four or something, Martin also spells it out:
“The Night’s Watch has forgotten its true purpose …. You don’t build a wall seven hundred feet high to keep savages in skins from stealing women.”
Which is to say: there’s a bigger threat than the one we are focusing on. What’s interesting about the White Walkers – this invasion force that is building, is the parallels with disease. They share similarities with zombies and can easily be read as a metaphor for infection.
So Game of Thrones is about a society that ignores its own history and warnings. Of course, it is about our society too, our petty spats and pathetic attention spans that mean we forget what matters and focus on what excites us. We run down our defences until it is almost too late. We take the bearers of warnings, and laugh at them. We let a pandemic run riot.
WINTER IS COMING
There is one clan in the book that warns of impending doom. The Starks. Their motto: Winter is Coming. They’re the main heroes of the book, and – I hope I won’t spoil the story too much here – few Starks get to have an especially lovely time of it.
Stark, adj. providing no shelter or sustenance. “A stark landscape.”
Now, what’s clever about the fictional world author George RR Martin has created is that winter is unpredictable. It comes when it pleases, lasts for an unknown amount of time. Winters are frightening. Some are brief, few are harsh. A pareto distribution. Then every so often – just like quakes and fires and floods, volcanoes and recessions – a really big one comes.
“Thousands of years ago, there came a night that lasted a generation. Kings froze to death in their castles, same as the shepherds in their huts; and women smothered their babies rather than see them starve, and wept, and felt the tears freeze on their cheeks… In that darkness the White Walkers came for the first time. They swept through cities and kingdoms, riding their dead horses, hunting with their packs of pale spiders big as hounds.“
This story is told by a character named Old Nan. She’s a fulltime childcarer. She has no status, meets with no powerful people. But this story – not told by anyone else – is one of the most important warnings in the entire narrative.
Her story – a kind of oral history if you like – has apparently been passed down for thousands of years. Of course, truth is stranger than fiction. If you write a book about a society that has forgotten its history, you must put in hundreds of generations between the last disaster and the present to help readers believe it is forgotten.
But of course the last huge global pandemic was in some people’s lifetime. In real life, we apparently discard memories and lessons of the last disaster rather sooner.
“If we forget where we’ve been, what we’ve done, we’re not men anymore. We’re just animals.” – Samwell Tarly, A Game of Thrones.
A bit over ten years ago, the city of Brisbane flooded. It was a major event. I watched a lot of news that week, and they played and replayed this amazing video. It captures one perspective on the floods, from a town just outside Brisbane.
The 2011 flood was the costliest flood in Queensland history – but not the biggest. A flood in 1974 had brought higher water levels. The incredible urban growth in the intervening years, however, meant 2011 was a bigger deal, affecting more people.
We learn a couple of surprising things about memory from this event.
First, the 1974 floods helped save Brisbane from even worse in 2011. One of the good things about the flood was the small amount of warning authorities were able to provide of imminent rising waters. (Albeit not enough to save the cars in the above video!)
Before the flood peaked, news media was able to warn local residents. An episode of current affairs program 7.30 aired before the waters peaked. Presenter Leigh Sales: ‘Even with the emergency response in full-swing, some experts in disaster management believe it’s not too late to learn lessons from the devastating floods of 1974’. The segment interviewed a survivor of 1974, and others.
I thought whether or not an event is publicly and widely remembered would be set in stone at the time of the next disaster. But that is not the case. So long as records exist somewhere, so long as memories are held by private citizens, they can be flushed out and made into public memories Another example: the ABC in Brisbane got people to send in photos of flood markers and flood memorials from the 1974 event – many of which were unobtrusive, mousy little things you’d easily miss – and collated them on a digital map in Brisbane.
One of the tenets of disaster memory is that memory of old events is re-activated by new events. You can see this in the very blog you’re reading – the obvious reason I’ve become focused on memories of Spanish Flu is the current pandemic!
This Google Trends data shows the same thing – Spanish Flu emerged from obscurity to become suddenly a scorching hot topic in 2020.
The historian whose work I’ve relied on for understanding the Brisbane Floods is Scott McKinnon. His paper “Remembering and forgetting 1974: the 2011 Brisbane floods and memories of an earlier disaster” is brilliant. Here’s a great quote from it:
“Sally and her partner, Jane, for example, lived in the ground floor flat of a two-storey and two-home dwelling. Their actions in the flood were largely determined by the memories of a neighbour.
“A lady across the road, Margaret, was in the ‘74 flood and she came over and said, “If it’s going to be worse than ’74, you girls have to get out, or else be up top and get everything you can up”.”
Sally and Jane were shocked into action, and despite being trapped, survived.
Memory matters. It helps determine how we respond to the next disaster. We can reactivate memories. This is why it’s so important to understand how we forgot the Spanish Flu. But as McKinnon points out, our memories are not always helpful.
HISTORY IS WRITTEN BY THE VICTORS
You’ve probably heard the expression. This – it turns out – is true not only of wars but, in a strange way, of disasters too. History is written by survivors. In Brisbane, the memory of the floods is of triumph over adversity.
“I want us to remember who we are. We are Queenslanders. We’re the people that they breed tough, north of the border. We’re the ones that they knock down, and we get up again.” Queensland Premier Anna Bligh.
McKinnon’s whole bit is digging out the memories that are excluded by this way of looking at history. The marginalised communities. The people who died. The ones who got PTSD.
This really speaks to me because I am fascinated and appalled by war stories that involve a narrator who survives against terrible odds. I have been since I read about Roald Dahl’s ludicrous run of good luck that led him to survive World War 2 and go on to be an author.
His story is survivorship bias at its most obvious, but it is there in every war story. Actually, all the stories we hear are survivor stories. People who die in wars, people who die in disasters, they don’t get to tell a story. Their story can be told by someone else, but we never hear their perspective
“It was horrible, but somehow we survived,” people say. Somehow the city survived, somehow the country survived. The thing that survived is abstract – but lots of very real things didn’t survive at all. The “somehow we pulled through” narrative emphasises what endured.
This statue in Lisbon honours King Joseph I’s response to the Great Earthquake of 1755, which opened up 5-metre wide cracks in the earth and killed 30,000-40,000 people.
McKinnon cites renowned memory researcher Astrid Erll: “Things are remembered which correspond to the self-image and the interests of the group’. This is the second major lesson of the Brisbane Floods.
We make public memories that make us feel comfortable and reassured, ones that don’t make waves.
I never imagined this when I dived into learning about disaster memory. It’s not just time that kills memories, such that they die off slowly over time, it’s not just convenient narratives either. It’s power. Oh shit.
“What should we remember about ourselves?” is arguably the question that sparks the culture wars. Once you start thinking about this, it is strange how memory is at the forefront of culture war topics. It could be pulling down statues, or re-naming parks. It could be a Prime Minister objecting to a “black armband view of history”. It could be a major journalistic effort like the 1619 project, which aimed to give new perspective on the history of the USA.
In a way I’m horrified by this – I wanted to write about volcanoes, not the bloody culture wars! But the more I look at it the more I can’t deny our identity is formed by remembering certain bits of the past and forgetting others. Which is affected by who has power. It’s not the only factor but you can’t address collective memory without thinking about it.
When we make collective memories about disasters we need to be aware of the fact that they are also affected by these powerful forces. Even in the context of something seemingly apolitical, like a flood, this happens. The ten-year memorial video made by the ABC, for example, focuses on the rescuers – the heroes – and concludes with a rescue technician talking about a letter he got from someone he rescued. “That’s probably one of the things I cherish as a memory of that day,” he says.
It’s a nice note to end a video on. But is the rescuer the most important thing to remember about the floods? Is it the sort of memory that will make us change? Or is it just a memory that makes us feel safe and comfortable? As McKinnon puts it, one of the way we create memories of disasters is as “successfully negotiated moments securely located in the past.”
It’s over, it’s finished, we handled it, we don’t need to worry about it.
Such memories discourage people from rocking the boat. Which is exactly the way of thinking that meant we weren’t ready for Covid-19.
“We believe that if an event is historically significant – if it affects many, many people, if it changes the fate of countries in the world, if many people die from it, it will inevitably be remembered. That’s not at all how it works.
We go through earth-shattering disasters. Ones we can learn from. Afterwards, we forget the disasters and throw away the lessons. When the disaster happens again, we are flabbergasted. We throw our hands in the air. The word unprecedented issues incessantly from our stupid mouths. Millions of people die.
We need to learn from the pandemic. But the lesson of the pandemic is not to prepare for pandemics. I mean, that has to be part of it. We should harden our defences against rogue strands of RNA. Staff the labs. Stock up on swabs. But if all we learn is that, the most obvious point, we’re missing the big upside.
The opportunity here is to learn the pattern. The next major crisis probably won’t be a pandemic. It will be something else we’ve gone through before, swore we would never endure again and are busily forgetting.
An earthquake? A volcano? Floods? A financial crisis? A computer virus? Terrorism? Rising fascism? A big war?
Flood marker, Albury NSW
The incidence of these events comes in a Pareto distribution, as discussed in Part 1. Occasionally severe versions clump together and scare us senseless. Occasionally they disappear, lulling us into a state of complacency. We encounter a lot of the mild versions of each class of disaster – low floods, gentle earthquakes – and begin to see them as regular benign background events. But in a Pareto distribution a majority of the impact comes from a tiny fraction of the instances. Yes, the last computer virus hit a few hospitals who recovered quickly. The next will be small too. The one after that though? It could be the big one.
Disaster memory is a thrilling field to be learning about. I started thinking about how we remember disasters a couple of months ago. Before long, I found I couldn’t stop thinking about it, and began looking for information. Often that’s a dead end. But in this case, boom. Loads of research! And it’s fresh. This is a major area of interest right now. The researchers are young, dynamic and they are active.
THE HOWLING WIND
I jumped on Skype last week with a guy from Cambridge called Dr Rory Walshe. He has done a ton of really amazing field work on cyclones in Mauritius. That’s right, his latest research required him to quit rainy England for a tropical island, so you know he’s a smart guy.
Walshe’s paper on that research was published in the International Journal of Disaster Risk Reduction in 2020. Cyclones are a particularly important type of disaster to remember accurately. Because the eye of a cyclone is a trap. If you forget that a cyclone has a lull then returns with a vengeance, you can be a long way from safety when the wind returns.
Walshe’s research involved over 130 community interviews with citizens on what they remember about cyclones. It revealed, in some pockets, dangerous beliefs about the cyclone eye.
“If the rain stops and the wind goes away, it is safe to go outside, it never comes back,” said one respondent.
You might think old timers would know about the eye of the storm and kids would be ignorant.
But Walshe finds the picture is more complex:
“The results demonstrate that the dynamics of forgetting are not as simple as a steady demographic churn over time as eyewitnesses pass away. Cyclones (and other events) are not forgotten in a gradual, uniform or passive process over time, contrary to the statement; “the forgetting curve is logarithmic, the more time that has passed since an event, the weaker are the memories about it” (Fanta et al., 2019). Mauritius demonstrates several exceptions to this statement and those like it, which suggests that the creation and loss of memory is a complex process.”
It isn’t just time that kills memories. They don’t die of old age. We kill them. And the weapon of choice is narratives we create to explain the world as we experience it.
“Throughout the history of Mauritius there were periods when we were cyclone free, and people attributed that to the island being deforested, [they said] cyclones will not come anymore.” – Mauritius expert interviewee, reported by Walshe.
Nothing could be more natural than for people to create narratives to explain their perceptions. Long quiet periods get explanations – perfect, simple and wrong – and those explanations, when the next disaster comes, are fatal. In Mauritius it has now been quite a long time between cyclones, and dangerous beliefs are rising.
“We have noticed climate change here; summer is very hot, and winter is very cold. that’s due to climate change, and its why we will not have the same kind of cyclones like we used to have,” – Mauritius community interviewee, reported by Walshe.
Hearing about how Mauritius explains away cyclones, I can’t help thinking about The Great Moderation. This once-popular theory on why recessions were so rare these days reached peak popularity in the 2000s …. just prior to the Global Financial Crisis. Among the anguished howls of the millions cast into enduring unemployment, if you listened closely, you could hear the embarrassed murmuring of the macroeconomists.
Lucas, you sweet summer child. This was published in 2003.
The belief recession risk had been moderated might even have been a contributing factor in regulators permitting all those crazy home loans. Speaking about dangerously glib explanations, we should also cast a side-eye at the Golden Arches Theory of Global Conflict, the very appealing claim that two countries with a McDonald’s have never gone to war. The implication is economic linkages reduce the risk of major global conflict. (Of course China and America seem to be fighting because of trade as much as anything.)
A medium Sprite and a side of global peace, thanks.
PINING FOR THE CALDERAS
When I spoke to Walshe, he felt a bit cloistered by the pandemic. Supposed to be in South America right now learning how societies respond to the threat of volcanic eruptions he is instead trapped in a flat somewhere in the UK. About six times during our conversation he expressed his desire to be in Patagonia instead of at home!
Rory was a delight to speak to, well-informed, insightful, generous with his time. He apologised afterwards for being “off his game” having had the AstraZeneca vaccine the day before our chat and suffering through a sleepless feverish night. I hadn’t noticed he was off his game, but the fact of his vaccination brought to the forefront the reason for my inquiries: the pandemic.
We began to forget the Spanish Flu almost as soon as it had ended. What other events are out there, ignored by history, waiting to come back and bite us?
I’m cross. All around me I see people learning the wrong lessons. If we waste 2020, if we fail to draw the correct lessons from it, that will be a worse disaster than the pandemic itself.
The world was ill-prepared for the pandemic. Terribly ill-prepared. Cast your mind back to March or April 2020. The shortages, the confusion, the awful and irreversible policy failures – they were not evenly distributed across the world.
Early success in battling the virus was seen in some countries. Taiwan did well. Mongolia had almost no coronavirus for about a year. China cracked down hard and has kept SARS-nCov-2019 from circulating for most of the past 12 months. Australia, despite some big blunders, did well too.
The countries that did better are mostly in Asia. Recent experience with SARS made these countries far more pandemic-aware and left them far better placed to fight the virus. They had not forgotten the risk of plague. How did they remember? Not because of something that makes their societies more cohesive. Simply because of recent experience. Little time had passed since they last faced a deadly contagious disease.
RECENCY
The importance of recent disaster experience is plain for me. I remember Black Saturday vividly. Black Saturday was a day of death. On 7 February 2009 the temperature reached forty-six-degrees (115oF) in Melbourne, Australia, the city where I live. By nightfall that day 173 people had burned to death in a series of enormous, linked infernos that turned the land into a hell where fleeing the fires was likely to leave you dead in your car, and staying still would leave you in the merciless path of enormous flames
Haze choked the sky. I remember checking the Bureau of Meteorology’s rain radar that day and looking at the strange patterns the radar identified as heavy rain. These were not rain, but smoke. Enough particles of plant, of animal and of person were lifted into the sky by the blazes as to leave a huge radar signature. Those fires were enormous and they made a tremendous mark in our memories.
Eleven years later, in the summer of 2019-20, intense bush fires raged again in Australia. This time instead of one very bad day, they lasted for over a month. The fires burned 40 times as much land as the Black Saturday fires. By almost every count, the fires were worse – every day was a state of emergency. The smoke cloud travelled around the world. And yet the fatality count was far lower, at 34 deaths. The living memory of Black Saturday is a huge reason why. We all knew how many people had died in Black Saturday, and we knew how they had died – by not evacuating early enough. The fresh collective memory of tragedy prevented the recurrence from being even worse.
UN-PRECEDENTED
Throughout the pandemic I have become absolutely fed up with this word: “unprecedented”. You hear it everywhere, usually on the lips of people who ought to know much better, people whose copy of the OED will tell them what that word means. The world has experienced pandemic before. Often. Ebola raged in West Africa within the last few years. SARS hit China in 2003. MERS was a small but even more recent zoonotic respiratory virus, hitting in 2012 with a fatality rate of one in three.
In 2003, on a train, at the Mongolian-Chinese border. They didn’t swab me, so far as I recall, but they did read my temperature.
The big reason we should have been ready for a big pandemic is not those serious yet contained outbreaks confined to a handful of countries. It is the fact that just 103 years ago – practically within living memory – the world experienced the Spanish Flu. The 1918 pandemic killed 50 million people. FIFTY MILLION! In a global population that was then much smaller, perhaps 25 per cent of what it is now. What’s more, that flu virus was “atypically fatal to those aged 20–40 years.”
How is it that the memory of this enormous tragedy is not carried forth, memorialised publicly, and even more importantly, embodied in extremely good pandemic preparation practice?
Compared to Spanish Flu, we’ve gotten off lightly for our ill-preparedness. Covid-19 has killed almost 3 million so far, and has mostly spared the young from death. We could have had it much worse, and the reason for a better result this time is, emphatically, not our careful tending to the lessons of history.
DOOMED TO REPEAT IT
The Spanish Flu was not part of our mainstream discourse on risk. They called it “The Forgotten Pandemic.” In 1924, Encyclopedia Brittanica published an enormous compendium on the preceding quarter century of history, titled “These Eventful Years: The Twentieth Century in the Making, as Told by Many of Its Makers; Being the Dramatic Story of All that Has Happened Throughout the World During the Most Momentous Period in All History.” I sounds like a good read, containing a chapter by Marie Curie on radium and a chapter by Sigmund Freud on pscyhoanalysis. However, it mentions Spanish Flu not even once. A search for the term “pandemic” in its pages reveals no mentions.
But why? Spanish Flu was not so long ago for its history to be written on shards of papyrus that crumble when we touch them. Colour photography had been invented. The New York Times was operating then. The Times of London too. There are people wearing masks in nursing homes right now who were alive during the last big pandemic. We say Lest We Forget when it comes to the big war that ended in 1918, but when it comes to memories of the pandemic – which killed more people than the war, mind you – it’s more a case of … forget what? It languished in the shadow of World War One and was forgotten even as soon as it began.
That forgetting meant the chance of us being ready for coronavirus was slight. And then a century passed.
What limited pandemic war-gaming that did take place in the United States revealed the country to be woefully ill-prepared. America was hardly alone, it is simply held up as an example of a country that *should* have had the resources to defend against the threat. Bill Gates tried to warn them, after all, as this 2015 video shows.
Now, vaccine technology is helping some countries make up for their monstrous early errors. The efforts of the scientists are heroic and should be applauded. But they are not reason to ignore the lesson, which is this:
We forget.
We really ought not to. We ought to know some disasters come around only rarely. But when time passes, and for certain other reasons, we let some events fade into oblivion.
Letting disaster memory erode like the half-life of some isotope is not good enough if we want to protect society. But some events recur in a way that makes us blasé. Earthquakes, viral outbreaks, volcanoes, tsunamis, recessions, terrorist attacks, even wars. All have apocalyptic versions that come rarely and irregularly, plus mild regular versions that wear down our will to maintain vigilance. This is the perfect recipe for society to forget.
THE BIG ONE
They say 80 per cent of the insights come from 20 per cent of the philosophers. 19th century Italian mathematician Vilfredo Pareto is found firmly in the small but important group on whom we depend.
Pareto lends his name to several key ideas in maths and the social sciences, but what is most important for our purposes is the pareto distribution. Pareto distributions are the ones that surprise us. They differ from normal distributions, or bell curves. In a pareto distribution, the tail of the distribution is responsible for the extreme majority of its impact.
For example, a tiny minority of the earthquakes in any time period account for the large part of the seismic energy released, as the next graph depicts. Earthquakes over 6.5 in scale are in yellow, those over 5.3 in green.
Similarly, the average pop band gets most of its Spotify spins from a minority of its songs, the average company makes most of its money from a handful of its products, 90 per cent of the salary cap for your favourite sports team goes to a minority of players, Most of the people in Australia live in a handful of cities, etc.
The pareto distribution is everywhere – even in disasters. A minority of the cyclones do most of the damage, a few tsunamis are much worse than the rest put together, the largest terrorist attack in history has a death count several fold higher than the second largest, etc.
This matters, because when pareto distributions happen over time, the interval between serious events will be random, and potentially large. Look back at that earthquake graph above. Until the magnitude 9.1 Indian Ocean quake in 2004, there was no sign of a quake of anything like that size in the preceding 30 years.
That means two things:
IN the aftermath of a rare and major disaster, we will usually castigate ourselves for not understanding it was possible, zero in on only the disaster that just happened, and prepare, quite specifically, for it to happen again. Even though it is no more likely to happen again.
Later, when a great deal of time has passed, we will conclude that we overreacted. We will dismantle the institutions we built, reduce our defences, make savings, forget what really happened, and become overexposed. That is when the severe risk emerges. (However the simple passage of time is not the only cause of forgetting. More on that in a future post).
Big White Swans
Nassim Nicholas Taleb coined the term Black Swans to describe unforeseen events that do great damage. The idea behind the coinage is that nobody had seen a Black Swan before, only white swans, and nobody ever expected black swans were even possible.
It’s not his fault the idea went viral. It’s our fault for believing it, for not seeing it as the ego-massage that it is. We are exceedingly complimentary to ourselves by imagining only black swans can screw us up, that only the unforeseen can assails us. This is conceit, it is arrogance, and it is part of the problem.
The more I learn about disasters and forgetting, the more I come to realise society suffers regular and devastating attacks by plain white swans. “HOLY HELL WHERE DID THAT THING COME FROM?” we ask as the swan’s pointy beak tears at our flesh.
How can we be expected to prepare for that which we’ve never seen before, when we can’t even properly prepare for what we have seen time and again?
I started this blog 10 years ago, in what was probably the best decision in my professional life. I left my public service job and began what became a whole new career.
It started out like this, just a bunch of ideas on the wall.
And after a lot of hard grind, today it looks like this:
There were speed-bumps of many kinds. Including a terrifying moment when I tipped water all over my computer a few weeks before the book was due.
Rice didn’t rescue the machine. So I put it in the oven. That seemed to help a little bit and I was able to turn the computer back on.
The big mistake I made was what I did next – blasting it with a hairdryer. I melted half the keyboard and the “I” key came off completely. I struggled through the end of the book with a warped and wobbly 25-letter alphabet under my fingers.
But it got done, and it got out, and now it is in bookshops, alongside a lot of very serious authors!
I just re-read Malcom Gladwell’s book Outliers – picking it up again with the goal of cribbing from it what is necessary to write a best-selling piece of pop non-fiction.
While I’m not yet clear on how useful it was in that sense, the book’s contents surprised me. What I vaguely remembered as a tome about the secrets to success is in fact anything but.
Sure, it contains the chapter on the “10,000 hour rule.” But the vast bulk of the book is framed around something far less like “self-help.”
Gladwell (source: Wikipedia)
The book is really about why people succeed because of circumstances they did not create. My favourite example, the simplest and most arbitrary in the book, is to do with why professional Canadian ice hockey players are disproportionately born in January and February.
Canada groups junior ice hockey players by year of birth, so kids born in January play mostly against kids younger than they are. At that age, Gladwell explains, a few months makes a big difference. The older kids are naturally the biggest, strongest and most coordinated. They get chosen first, then rewarded for their superiority with more opportunities, more games, more coaching etc. The rest is path dependency.
I like this theory (and not only because as the youngest kid in my year at school I was particularly unsuccessful at sport). It makes an intuitive kind of sense that success is to do with luck as well as talent. For example, while some very dedicated short people have played professional basketball, the luck to be born tall is a big part of your ability to make it in the game. The book is stacked with examples like this.
TIMING?
So the Gladwell book is basically about privilege. It’s about how successful people are the product of a confluence of factors they don’t control. There’s even a fantastic chapter on Gladwell’s own Jamaican heritage and how perceived light-skin tone helped his forebears.
Privilege in general, but especially white privilege and male privilege, are some of the hottest and most contested topics these days, this book is pretty much completely about them, and yet it wasn’t swept up in the debate.
‘It’s weird’, I found myself thinking. If this book had come out now it’d be part of a fierce partisan culture war. Gladwell would be reviled in the pages of 4Chan. He’d be a cuck and an SJW and a whipping boy.
But it came out a while ago and so it missed that.
How, I found myself wondering, did this major book, that sold so many copies, miss the cultural moment so narrowly?
I did what I always do when faced with these sort of questions, and headed to Google Trends (where Google measures interest in various search terms). What I found raised my eyebrows.
The privilege line kicks up to a new level in around late 2008, early 2009 – the precise time the book was released. Is it possible, I asked myself, that we’re looking at cause and effect here? Did the book make people more interested in the concept of privilege?
Of course, people were googling the term both before and after the book’s release – but some of the traffic will be completely unrelated to this sense of privilege. (A fair part of it will be people trying to check the spelling).
A tricky one.
The lift in interest in searches for privilege still needs to be explained. The 2008 US Presidential election and the identity of its winning candidate is definitely a possible explanation for a rising interest in the role of privilege in society at that time. But what makes plausible the attribution of at least some of the lift in interest to Gladwell is the incredible success the book had. Outliers hit number one on the New York Times bestseller list upon debut, and stayed there. It went on to sell over 1.5 million copies and on the way became a sort of cultural touchstone.
Nowadays, Malcolm Gladwell’s combination of popular style and popular success makes him unfashionable. (The public refutation of the 10,000 hours rule didn’t do wonders for his brand either.) Few would attribute their awareness of the role of privilege in society to Gladwell.
While pondering that, consider this quote from John Maynard Keynes:
“Practical men who believe themselves to be quite exempt from any intellectual influence, are usually the slaves of some defunct economist. Madmen in authority, who hear voices in the air, are distilling their frenzy from some academic scribbler of a few years back.”
(For “practical men” you may substitute “insurgent cultural theorists with impressive numbers of twitter followers.“)
Now, I’m not saying that Malcolm Gladwell invented the concept of privilege. Clearly, the concept has been a part of the study of humanities for a long time. I’m not even saying that he introduced people to the academic sense of the term. The word is far from prominent in the book. But he does relentlessly slay the conception, so dominant until recently, that success depends solely on hard work or inherent talent.
Gladwell lays bare several structural factors that lift some people up while holding others back. And more important than that, he makes those factors memorable. In doing that, Outliers potentially opens minds to a more critical analysis of why some people – and some types of people – seem to be able to squeeze more out of society.
That may have prepared the earth for a rising interest in the topic of privilege as the years have gone by, and the more recent and far more dramatic upsurge in awareness of the concept of privilege when it comes to race.
If this is even in some small way Malcolm Gladwell’s intellectual legacy, then Outliers was a particularly powerful book. If I can, using techniques stolen from him, write something with a fraction the impact I’ll be delighted.
We sit at an inflection point, extrapolating it to the stars.
Technological progress seems suddenly overwhelming. But there is reason to expect a breakdown in the recent rate of growth, reason to expect that we’ve grown deluded about the prospects of the silicon-based slice of progress we like to label “technology.”
I wrote about this the other day in my regular column over at News.
Suddenly people are taking seriously all the following ideas:
This is not just about people speculating on the future of a few companies. This is about believing the life of humans is about to change faster than ever before in human history. It is like a belief that we’re living through the agricultural revolution, the Renaissance and the Industrial revolution all at once — and all in fast forward.
Why so credulous?
Why do we suddenly believe technology will remake the future so utterly and swiftly? Partly because of a cognitive bias called the recency bias. We remember the recent past much better than the time before it. And in the recent past, technology has wreaked havoc on modern life. You’re reading this on a website that didn’t exist before 20 years ago.
In the past 20 years, the world has changed a lot. And technology has been a big part of it. But that doesn’t mean technology can change everything. The personal computing technology we all interact with daily has made it very obvious to us that technology can change very fast.
But this is a classic case of selection bias. If we try to measure the pace of technology by looking at the things that are changing very fast, we will get the wrong picture. We need to look elsewhere too.
If you tried to measure the pace of technology by looking at commercial aviation, say, what you’d discover is a lack of obvious progress. We used to have supersonic commercial aviation, but nowadays most of us fly around in Airbus A320s (a plane launched in the 1980s) and Boeing 737s (a plane first launched in the 1960s).
You can get a similarly glum feeling if you look at progress in fighting Alzheimers disease or Multiple Sclerosis. There hasn’t been any, despite a huge amount of effort. Likewise with the common cold — and we seem to be losing the battle against bacteria as they develop antibiotic resistance.
I don’t mean to say that technology won’t change. It can and surely will. Just to say that there is a certain wildness to the predictions of the future at the moment. People seem willing to believe just about anything, so long as it has a technology angle.
When the bubble finally pops, it will take with it not only the valuations of some of the biggest technology companies, but also a lot of utopian visions of the future.
In the News story I call it a recency bias but you might as easily call it an availability bias. We are very willing to believe technology can change the world utterly and quickly because in living memory personal computing has created very visible changes in our daily lives. (Maximally visible, but not necessarily maximally important – the famous hypothetical is whether you’d give up the internet before you gave up indoor plumbing.)
IT’S THE STUPID ECONOMY
These cognitive biases have been allowed to grow unchallenged because of the peculiar financial circumstances of the times.
Some people argue the loose monetary policy of the last decade does not explain high asset prices, but I think they’re wrong. The simultaneous global bubbles in property, bonds and tech stocks almost certainly trace their roots to the low/zero/negative interest rates across much of the world, and quantitative easing that left developed economies awash with liquidity.
The money flood provided patient capital that gave companies with scant profits a long time to experiment and expand revenues. If you’ve ever taken an Uber using a 50 per cent discount, you’re using some venture capitalist’s money to improve your own lifestyle, while simultaneously propping up the impression that new tech is destined to remake the known world.
(For what it’s worth, Uber is pretty big improvement over taxis! But its major advantage comes from taking on a regulated market with colossal rents, rather than being inherent to the app.)
The money flood has propped up some far more dubious beliefs than the prospects of Uber. The faith certain investors have in Tesla’s ability to win a giant share of the “shared mobility market” (fleets of driverless taxis) is intriguing to me.
Valuing a junior company on the prospects of winning a large share of a market that doesn’t yet exist, using technology that is in its infancy? It seems, um … more optimistic than is prudent. If this kind of thing works for Elon Musk, perhaps he should also set up Red Real Estate and start selling rights to land on Mars.
The NASDAQ chart above explains why the cognitive bias we’ve developed has been allowed to progress so far. It’s a feedback loop from confidence, to investment, to expanding revenues, to stock prices, to headlines, to confidence.
And Bitcoin?! … . Actually no. Let’s not even talk about Bitcoin.
(Non-financial evidence that technology really is changing the world, in the shape of temperature records and CO2 concentrations, doesn’t seem quite so influential on the mass mood. I leave it to the reader to ponder why.)
Eventually, the technology cycle of misplaced confidence and out-sized valuations will find it has reached the highest possible equilibrium and begin to tack backward.
“The trend is your friend, til it bends.” – Anonymous.
It is likely to do that even absent a macroeconomic reason, but one is coming anyway.
Interest rates are rising in the United States and inflation is lifting. The anti-Keynesian Trump stimulus – adding fire to a booming economy – looks set to intensify those trends. The Fed is now slowly soaking back up loose money. This represents a clear and present danger to any asset whose value is not based on making real money right now.
If the market values of all those tech stocks fall, the stories they told about the future will suddenly appear thin. A pin will prick the bubble of credulity and the stories of inevitable autonomy, existential AI risk and imminent interplanetary expansion will fade from our front pages. The distance between the pssible and the probable will lengthen again.
So I’d like to place a stake in the ground and say we will look back on this era – with a TV show called Silicon Valley; a plan for Elon Musk to become the richest man in the world; non-stop headlines about drone delivery; and a relentless faith driverless cars were just a few months away – with a kind of nostalgia for a simpler and more optimistic time.
This post asks if we are making a mistake in the way we anticipate the future of robots and intelligent machines. It is all based on my perceptions and understanding of how far our digital assistant/nemeses have got so far. Please comment below if you know of progress I appear not to be aware of!
–
I’ve been reading a lot about robots, artificial intelligence and machine learning. I am trying to weigh up what it all means. Will jobs disappear? Whose jobs? Who stays in work what do they do? Will we even need to work in future?
One machine I am definitely excited about is the new best player at chess. It dominates because we demanded that it teach itself. Within a few hours it beat one of the top systems in the world. That is exciting and also terrifying.
And yet. Some robots are still utter rubbish.
The Jetsons’ robot maid is nowhere to be seen in my life. There is little evidence of robots coming to dominate in many of the domains people insisted they would.
Voice recognition, for example, remains underdeveloped, despite years of focus. And yet the machines can turn around and defeat us at Go, the one thing we thought we could edge them on for another few years.
It seems to me we are bad judges of what intelligent machines will be good at.
Often, the machines are better at things we consider hard than things we consider easy. One of the first things machines came to dominate at was chess (a game for the human intellectual elite). They remain truly appalling at soccer (a game for everybody).
We assume things children could do will be easy for robots. And we scream with laughter when they find them hard. Later, we are amazed when machines can easily outstrip us at things only the smartest adults can do. This paradox needs resolving.
Why are they smartest at hard things and dumbest at easy things?
Are we benchmarking things wrong? Perhaps we over-emphasise how smart the adult human is; how capable of operating effectively in the abstract world. And underemphasise how physically capable the average adult human is in the material world.
Maybe what we see as hard is just abstract; and what we see as easy involves manipulating the infinite variability of the real world.
From where I work I can watch two turtle doves improving their nest. One flies out, finds a stick or bit of grass, and brings it back. The other takes it and works it into the existing structure with a wiggle of its head. I doubt we could program two drones to do that, even with a decade and a multi million dollar budget.
The nest in question. It is described by birdsinbackyards.net as “a loose platform of sticks” and is probably the worst nest in the whole avian kingdom, but still better than robots can do.
How different are we from the animals? Is it possible the animal parts of our brain are actually far more advanced than the human parts of our brain? Our software has had aeons to work on things like navigating 3D space, recognising and manipulating never before-seen objects, hearing and identifying sounds. But only a few dozen millenia to work on the higher human plane of logic and abstraction.
Computers operate in that abstract world and are – mostly – killing us at it. Arithmetic is their bread and butter. Accounting, logic and other kinds of rule following that defined human intelligence until quite recently are firmly within their grasp.
Yet machines attempts to navigate the physical world are mostly poor. If you consider how refined those animal circuits are, is it any wonder that machines still can’t do these animal things? If what we can do easily is actually very hard, it might be less surprising that our first iteration at self-driving cars smashes into giant objects right in front of them. And we might approach the task of training robots to interact with dynamic real world space with more humility.
ROBOTS TAKING OUR JOBS
If we have misconstrued the extent of human skill in various domains, could that lead to confusion about what tasks can easily be automated? Everyone seems to think truck driving is due for immediate automation. What if that is because of a sense that truckies aren’t smart?
Many people assume a chess-playing computer must also be able to do everything a person of everyday intelligence can do. Here’s Tesla CEO Elon Musk, speaking at the company’s annual earnings call on 7 February 2018.
“I am pretty excited about how much progress we are making on the neural net front… It is also one of those things where it is kind of exponential. … It doesn’t seem much progress, doesn’t seem much progress and then suddenly: Wow!
“That has been my observation generally with AI stuff . And if you look at what Google’s DeepMind did with AlphaGo. It went from not being able to beat even a pretty good Go player to suddenly it could beat the European Champion. Then it could beat the world champion. Then it could thrash the world champion. Then it could thrash everyone simultaneously.
“Then they had AlphaZero which could thrash AlphaGo! And just learning by itself was better than all the human experts.
“It is going to kind of be like that for self-driving. It will seem like this is a lame driver, this is a lame driver, this is a pretty good driver … [then] holy cow this driver is good!”
It seems to follow logically, but it might not.
We value abstract cognition because it is rare in humans. But we don’t value what is profoundly and abundantly available to us – skill in moving through the real world. That’s why the stock analyst gets paid more than the taxi driver.
Yet traders are already being replaced with algorithms. Taxi drivers – not yet. That could be a warning signal, and our model of intelligence could be impeding us from seeing it.
The smartest people applying neural nets to self-driving vehicles say they are still a long way off.
“Those who think fully self-driving vehicles will be ubiquitous on city streets months from now or even in a few years are not well connected to the state of the art or committed to the safe deployment of the technology. For those of us who have been working on the technology for a long time, we’re going to tell you the issue is still really hard, as the systems are as complex as ever.”
“I wonder how many of the people making predictions about the future of truck drivers have ever ridden with one to see what they do?
One of the big failings of high-level analyses of future trends is that in general they either ignore or seriously underestimate the complexity of the job at a detailed level. Lots of jobs look simple or rote from a think tank or government office, but turn out to be quite complex when you dive into the details.
For example, truck drivers don’t just drive trucks. They also secure loads, including determining what to load first and last and how to tie it all down securely. They act as agents for the trunking company. They verify that what they are picking up is what is on the manifest. They are the early warning system for vehicle maintenance. They deal with the government and others at weighing stations. When sleeping in the cab, they act as security for the load. If the vehicle breaks down, they set up road flares and contact authorities. If the vehicle doesn’t handle correctly, the driver has to stop and analyze what’s wrong – blown tire, shifting load, whatever.
…
I’ve been working in automation for 20 years. When you see how hard it is to simply digitize a paper process inside a single plant (often a multi-year project), you start to roll your eyes at ivory tower claims of entire industries being totally transformed by automation in a few years.
COUNTERPOINT
Perhaps this argument is upside down. Perhaps we chose not to make computers good at the material word. Perhaps we trained computers to do abstract things because only a few people can do them. To get the benefit of training a computer we must set it on tasks where human skill is rare. It is not that they couldn’t do what we can do, just that we haven’t put in the effort.
FINDING THE PATTERNS TO RECOGNISE
I suspect the problem is not so much in asking computers to process the data produced by manual tasks as getting them to identify it as data.
In an abstract world data is always in the right place and fully visible. In a spreadsheet, the data you need will always be exactly in the right place. And if not, nobody expects the spreadsheet to figure that out and fix it. In the physical world, information might be harder to find. Where’s the label on this box? Where’s the face on this human? Where’s the road under this snow? etc.
We already know how you can get robots to take on jobs in the material world. You need to standardise the inputs. Robots do a wonderful job welding things that come down a production line. They do a great job driving trains in wholly separated systems. They do a perfect job of driving lifts up and down lift-wells, etc. In these cases we give the material world the standardised appearance of an abstract one. Take away the production line, the protected rails and the lift-well, and those systems are all at sea.
Neural nets will of course be much smarter than the computers that drive lifts. They will be able to parse information from the material world. Self-driving cars can use cameras, radar, lidar and 360 degree vision to get advantages over us in sensing. These systems should be able to learn fast.
But I am not yet convinced we can apply the lessons from an abstract world which has only 64 different locations, to a real world which is infinitely more complex. Assuming those lessons will cross over is the exact kind of intellectual trap a cognitively limited species would fall into.
Was the problem a shortage of cool plans? I didn’t realise the problem was a shortage of cool plans.
Yesterday, Tesla announced two new vehicles – a semi trailer, and a roadster. The launch was awesome.
Musk does theatre like a natural. Adding to the happy vibe was that he spent no time covering Tesla’s big problem, which is delivering on existing plans. Instead, he added more plans.
Here’s the problem with plans. Not everything works out. The more plans you have the more chances for something to go wrong.
When you have many independent systems, adding an additional system adds to your chance of one working.
However when each system is interlinked (by, say being in the same corporate structure, or worse, by being an input to another system) the rising chance of one failure increases the chance of mutliple failures.
For example, the gigafactory battery plant is an input to the Model 3 production line. Failures at the gigafactory are holding up production, imperilling the Model 3 and the whole company’s cashflow, and therefore its survival.
When you have interlinked systems, risk management is, in the long run, almost everything.
If you google “Elon Musk” and Risk, you find a lot about him worrying about the risk from artificial intelligence to human survival. And I could see nothing about him discussing his approach to risk management in business.
SELF CONFIDENCE
Elon Musk has a longstanding pattern of managing risk by insourcing. When something’s not going right he tries to solve it by doing it in house, or even personally.
Nobody wants their supplier to go broke because they forced the supplier to take on too much risk. If it happens you’re short on inputs. But if you bring the problem under your own roof and find it can’t be solved then you’re short on inputs and in a financial hole.
A list of things Tesla is doing in house that a regular carmaker doesn’t is… eye-opening.
Fuelling stations
Dealers
Repair shops
Energy generation and storage systems. (solar panels and batteries)
Developing autonomous driving systems
All of these are tricky. They may cost more to do than expected.
Just because this looks like a car company doesn’t mean it has the risk profile of a car company. Building cars is not the only prerequisite for success.
And of course Tesla is having all sort of trouble building cars. It has had big hiccups making the batteries and doing the welding. It also likely can’t fit all the planned production inside its current factory, meaning it will need a new factory to hit 500,000 cars a year. Tesla is being broadly upfront about this, with Musk referring regularly and breezily to “production hell” – although without giving much detail.
Solving production hell will take management effort and money. But the two new vehicles will divert effort and money. A juggling analogy may be apt. When you add extra balls, the juggler trying to control them drops the lot, not just the new ones.
The Roadster has some serious technical questions to answer, but – if it can be built – of course they can sell a lot of copies. It’s the world’s fastest car from the world’s coolest brand.
The truck, however, is not certain to sell. While consumers buy on brand and image, the logistics industry is relentlessly optimised around cost. The range Tesla’s truck offers (500 miles) demands an enormous battery, which will make the truck expensive to buy and increase its weight by an estimated 12 tons. That weight matters for at least three reasons
1. The total weight to payload ratio changes, offsetting some fuel advantages.
2. Road damage increases exponentially on a weight per axle basis and governments are increasingly keen to get the logistics industry to pay road user charges based on weight.
3. Trucks are sometimes empty and carrying a battery at those times raises the cost.
The truck also means Tesla had to invent a whole new charger to make sure their trucks could be charged in a reasonable time (30 minutes for 400 miles). It is unclear to what extent this new Megacharger has been invented as opposed to just envisioned. It is further unclear how much they might cost to install, or if they are compatible with existing electricity distribution infrastructure.
Incidentally, the time it takes to charge a vehicle means Tesla may need to install a high ratio of chargers to vehicles on the highways. We’ve all pulled into a petrol station to find all the pumps are in use. You wait three or four minutes and they become free. If the person in front of you is going to take 30 minutes to charge, and then you’re going to take another 30 minutes, you’ve got an enforced one hour stop. God forbid it’s busy and there’s more than one person in line in front of you.
The way for Tesla to combat this inconvenience is by installing *a lot* of chargers at places where people are taking long trips. (This problem should not apply at home, where people can charge their vehicle overnight, but it would apply if you’re doing distance travel, and especially to semi trailer trucks.)
CAPITAL IDEA
The Tesla semi trailer and the roadster are, however, not just extra risk. They can help Tesla raise capital it sorely needs. Pre-orders of the first 1000 roadsters are available by putting down $250,000. If they can find 1000 people willing to put 250k on ice for a few years, that will put $250,000,000 into Tesla’s pockets. Its most recent cash burn was $1.4 billon in a quarter, so $250 million would buy them an extra three weeks.
Congestion charging is back on my list of good ideas
For a while there, I was influenced by the equity arguments against it. The lack of substitutes to travel, and the unique role of commuting to work in a person’s well-being tipped me against congestion charging. Good economic reform doesn’t throw out equity every time it can get an efficiency dividend, and I decided congestion charging equity problems made the policy unworkable.
But I’m swinging back to support for a simpler price signal. What has captured my attention is the following graph from a new Grattan Institute report. It shows the extent of congestion in Sydney. Amazingly, most people experience almost no congestion. Their commutes are swift.
What this tells me is the the impact of a congestion charge is actually not likely to be widespread. Serious congestion, of more than ten minutes in a trip, is the purview of a small subset of commuters.
That subset is likely to be going into the CBD, where congestion is real.
Remember that despite the importance of CBDs, most jobs are still in the suburbs. If we know one thing about CBD jobs – especially nine to five CBD jobs – it is that they tend to be the good kind.
City centres are where the business services jobs are. The specialised jobs that pay big coin, as opposed to the population-serving jobs (pharmacies, florists, bakers, doctors, schools) that are found disproportionately in the suburbs.
It looks like driving into the city in peak hour is an elite problem. No wonder it gets so much attention. The Grattan analysis makes it clear the congestion charging would really only have to be applied in a narrow area.
This fact also counters the argument that congestion charging can’t be introduced until better public transport happens. Melbourne and Sydney have radial public transport systems that provide terrific CBD access.
Traffic is bad. The absence of price signals on the use of existing infrastructure causes crowding and delays. You end up listening to way too much FM radio. But that might not be the most costly effect. The big downside is probably the pressure to build yet more infrastructure.
Daniel Andrews has green-lit the West Gate tunnel – a big freeway that will not only soak up $5.5 billion but also lock Victorians into a regimented tolling regime (not a congestion charge system) for decades.
Big freeway projects have a lot of side effects.
One is making the places that they travel through less pleasant. Place-making is a big theme in urban planning now and a lot of money is spent on making areas seem nice. This “tunnel” which is actually an elevated road for a good section of its length,is kind of the opposite of place making.
A second side effect is city-shaping. You can cut travel times to the city, but that encourages yet more sprawl and inefficient urban form. (Thanks, marchetti’s constant._
If you want a policy that is likely to be equitable, can potentially conserve scarce government funds for more valuable projects, and prevent the paving over of the inner city, then congestion charging is your horse.
–
To finish with here’s some data to make you go “huh!” – rain, apparently, has no effect on traffic:
Sometimes you can see a policy change coming a mile off. For about the last two decades, drug legalisation looked like such a case.
The positive results of decriminalisation in Portugal, and the examples of marijuana legalisation in Uruguay and various states of the US were becoming more widely known. The Penington report in 1996 argued for decriminalisation of marijuana and when Victorian Premier Jeff Kennett ignored its recommendations it was seen as a stance justified only by retail politics.
It seemed only a matter of time before expert recommendations on decriminalisation and legalisation were taken on board by Australia and nations across the world. An armistice was about to be announced in the increasingly stupid war on drugs. So it seemed.
Then the opiates crisis began. America is in the grip of a really shocking wave of premature mortality, caused by addiction to opiates. The scale of it is really awful – at 32,000 deaths a year, roughly equal to the numbers killed by firearms in that country.
(If you’d like your faith in journalism to be restored utterly while your heart is smashed into a million irrevocable pieces, I recommend this piece, Seven Days Of Heroin, from the Cincinatti Enquirer.)
The US opiates crisis has forced some hard thinking on the merits of legalisation (for drugs beyond talking about drugs beyond marijuana, mostly.)
Opiates are not only a gateway to heroin abuse but a problem in themselves. Legal opiates accounted for 20,101 overdose deaths in the USA in 2015 compared to 12,990 related to heroin. If a legal drug, tightly controlled by law and available only under prescription, can be abused in a way that spirals way out of control, what does that say about the prospects of ending prohibition of drugs?
TOO MUCH TRUST
With legalisation, nothing is going to end up as available as buying flour at the supermarket. There will always be controls – regulation, licensing, etc. Choosing them is critical. But there is one shortcut we tend to take.
We love to rely on doctors as one of those controls. “Only available via prescription” sounds like a big barrier to drug availability. We have a lot of trust in doctors at a personal care level and that transfers over to a policy level.
Meanwhile, even the best-intentioned doctors are at the mercy of a pharmaceutical system that is itself far from perfect.
(If you’d like your faith in journalism to further cement while your faith in capitalism is smashed into a million irrevocable pieces, I recommend this piece, ‘You want a description of hell?’ OxyContin’s 12-hour problem, from the LA Times. It describes how a big Pharmaceutical companies lies about its products, got loads of people hooked on opiates and evaded a whole lot of systems designed to stop exactly that from happening.)
To some extent this is like the story on Elon Musk yesterday. It bothers me when too much trust is vested in an entity, person or institution that doesn’t deserve it. And nobody deserves as much trust as we invest in doctors without an panopticon of ombudsmans, review committees and inspectors.
I think we can move towards legalisation of drugs. But what is crucial in regulating anything is the fine details of the way they are controlled.
Hoops to jump through
I wrote about this in The Right Amount of Smoking. Finding the exact sweet spot for control and legalisation is hard. You can fiddle with public and private ownership of suppliers, taxation, occupational licensing, sales licensing and controls on consumption.
At this stage, we probably don’t have enough controls for gambling, and we have too many of the wrong kinds for most drugs.
Finding the right kinds of control is hard and requires ongoing adjustment of the policy settings. Trying to outsource the difficulty we have in solving that to doctors is an attractive shortcut, but not the answer.
Elon Musk gets on my nerves. Whenever I see him in a headline my teeth start grinding.
But why? I agree with all his goals. I love the idea of clean energy. I want better batteries. I’m excited by colonising the universe and digging cheaper tunnels. So why does his every pronouncement get me upset?
I’ve been dwelling on this recently, and can only conclude it’s because of the lack of public skepticism he encounters.
Fly to most places on Earth in under 30 mins and anywhere in under 60. Cost per seat should be… https://t.co/dGYDdGttYd
Whenever I think about the future, I like to consider it in probabilistic terms. So when I hear Elon Musk talk about using rockets to travel from New York to Sydney in an hour, I naturally try to imagine what the likelihood of this happening is. I generally come up with numbers awfully close to zero.
Apparently other people’s thinking goes off in different directions, wondering about comfort during take off:
I don’t find myself thinking about g-forces. I’m too busy puzzling over why he should be able to make a roof including solar panels for less than the price of a roof. What does he think roof manufacturers have been doing for all this time?
Musk is not short of ambition or afraid to make his life more complex. For example, the original Telsa plan had nothing in it about automation or self-driving. He just bolted that onto the plan, presumably expecting it would be doable if the engineers just tried hard enough.
I remain skeptical.
When people think about the progress of science, they have an awful tendency to be swayed by survivor bias. They think especially about progress in personal electronics – because that’s where the progress is. They infer that technology can utterly transform itself with a decade or two.
But when you take a broader sample, you see something different. For every iPhone that did get invented, a flying car failed to be. While we beat back AIDS, cures for dementia and multiple sclerosis languished. And not for want of effort. You can’t tell in advance which fields will yield to effort.
I was a big fan of an old website called Paleo Future, which goes back and looks at old predictions of the future. They’re mostly silly.
In fifty years, most Musk plans will seem as silly. But they’re being repeated across all forms of media. That credulity, and the adulation that goes with it, really rustles my jimmies.
The other relevant cognitive bias is the base rate fallacy. People ignore the fact that in a given domain (colonising space, say) background probabilities of success are very low. They prefer instead to focus on some other seemingly salient factor, like whether the person making the plan to do so is a genius. (And I’m perfectly willing to admit Musk is.)
Now, the charm of having so many cognitive biases running in your favour, is you can attract a lot of capital and hire a lot of good employees. You get to make a lot of bets at once. Take one 5 per cent chance, you’re set to fail. But take ten and you have a 40% chance of one of them coming good.
So I’d be surprised if everything Musk tries from hereon turns to poop. He can probably go down in history as a genius inventor. But at the moment he’s getting way ahead of himself.
STRATEGIC THINKER?
Musk’s strategic thinking has worked well so far for Tesla, but past performance is no guarantee of future performance. You only need to look back on his Tesla “Master plan Part Deux” from 2016 to get a sense of how iffy it can be. It contained a very peculiar section on taking the aisles out of buses to make room for more seats. Ignore for a moment that aisles are important to buses – the point is that that kind of fine detail has no place in a strategic plan. Shortly afterward, he walked back the whole section on buses anyway. The whole thing made me wonder if his success came because of or despite his strategic vision.
It is possible that long before he has a chance to be proven wrong on intercontinental travel, Mr Musk will have a reversal of fortune.
MODEL 3
Tesla’s plan to ramp up production of Model 3s in a new facility looked risky to me from the start. Manufacturing is hard and Tesla is new to doing it at scale. Today we learned initial production of the smaller more affordable car has fallen short.
Expecting to move smoothly to mass production was pure hubris – big new projects regularly have huge cost overruns and delays. (I used to work on Defence projects so I’ve seen cost overruns and delays.) Furthermore, in making its new factory, Tesla skipped a step most manufacturers use, getting all its tooling made before they’d had a dry run. That will save time and cost only if all the systems fit together neatly and as expected.
I understand why they’re rushing. There’s two reasons Tesla must sprint to survive.
First, so much debt has been brought on that they need a lot of sales to pay the interest (with the share price so high I don’t understand why they wouldn’t just issue shares, which don’t need to be periodically refinanced).
So far Tesla burns cash just to stay running. Having big debt and negative cashflow is not sustainable. There’s not many times corporate finance is heart-in-your-mouth terrifying, but Tesla is making it like watching one of those guys in a wingsuit.
Second, the longer they delay the more competitors with proven manufacturing ability can catch up and steal the market. The Chevy Bolt is a proven success and we heard last week that even vacuum manufacturer Dyson is entering the electric car market. A Bloomberg article published today had a huge list of Tesla competitors. Fifty new electric vehicles are going to hit the market in the next five years, from companies with a strong history of making quality products.
I think the Tesla corporate structure needs careful steering to not end up on the rocks. The technology and brand could well be for sale within five years, and gleefully bought up by someone like General Motors or Google. That’d be awful for Tesla investors and employees but mostly fine for society, as the losses incurred in creating all this technological progress would be internalised by all the investors who’ve done their dough.
SHOULD I BE SO MAD?
So am I justified in being so cross at Elon Musk and all the people who believe in him?
One argument is I am not. To the extent that he is making great progress, I should shut up, and to the extent he is selling risky bets, his main victims are private investors who are welcome to include in their portfolios a few risky bets.
While money will be wasted, technology will also be created. If it has value, that technology will presumably be up for grabs if Tesla (or SpaceX, or Hyperloop) ever needs to make their creditors whole, and society will still be able to benefit from them. From this perspective, the cult of Elon Musk is just a big scheme to get private investors to take the risks of moving science forward. And it’d be awfully pig-headed to be mad at that.
From another perspective, investor money is finite, and we should be careful to steer it toward those schemes with the highest chance of success.
So tell me, dear reader. Am I being too much of a grouch toward Mr Musk?
I love government. But it is not a blind love. Government is not done as well as it could be. I’m very much for the idea of achieving collective goals to improve society, and very much open to reforming how we do that.
Here in Victoria we have two of the most potent and innovative public agencies: TAC and WorkSafe. The Transport Accident Commission works to reduce injuries and deaths from transport accidents. Worksafe works to reduce injuries and death at work.
They do a lot of good preventative work. Both have been very effective.
Victoria has the second lowest workplace accident rate in Australia, measured by fatalities (after the ACT) and by workcover claims (after the NT), as these next two figures show.
1.
2.
Victoria also has some of the best road safety performance in Australia. It has improved substantially over the last decade, as the next chart shows. (Of course, improvements in safety also come from improvements in cars themselves, but via programs like How Safe Is Your Car? the TAC encourages Victorians to buy safer cars, accelerating those positive changes.)
What makes Worksafe and the TAC effective?
Reason one is their independence. (The 2014-15 blip in Worksafe performance that you see in the above graph may be related to the state government meddling with its operations at that time. Independence matters.) They are statutory agencies free from direct ministerial control, giving them the ability to take extra risks.
The innovations that are most visible to the public are their communications – Worksafe sponsors a football team while the TAC pioneered using TV advertisements to change culture and reduce the road toll. This kind of communications strategy is rarer in government departments, where ministers face tough questions over spending.
The second, related reason is that these are not just policy agencies but insurers. Worksafe takes premiums from employers, and TAC from car registrations. They pay out when a worker is injured, or when a person is injured in a vehicle accident. This gives them not only a funding source independent of annual budget rounds, but also a clear financial incentive. (nb. Worksafe is also the workplace safety regulator and inspector, giving it further powers. TAC is not.)
These are both world-leading organisations which have had powerful positive effects on society, and organisations whose successes I have admired. So I was excited to see, earlier this year, the head of the Productivity Commission throw up a powerpoint slide with a dot point that argued we should “Address disease prevention as directly as we address workplace accidents.”
I was immediately captivated by the idea of using the Worksafe model to try to fight disease. The upside looks to be huge. Australia’s preventative spending on health is fairly terrible, as is well-documented, and was again confirmed in a paper by two Public Health academics in July this year.
“Treating chronic disease costs the Australian community an estimated $27 billion annually, accounting for more than a third of our national health budget.
“Yet Australia currently spends just over $2 billion on preventive health each year, or around $89 per person. At just 1.34 per cent of Australian healthcare expenditure, the amount is considerably less than OECD countries Canada, New Zealand and the United Kingdom, with Australia ranked 16th out of 31 OECD countries by per capita expenditure.”
Could we fix the preventative health spending deficit by setting up organisations akin to Worksafe and the TAC? Might it have the exact combination of novelty, innovation and actual prospects for success that could make politicians and public servants agree on it?
At a high level the opportunity seems to be there (for preventable diseases but not, so far as I can see, for non-preventable ones like MS). Does it persist when you dive down into the details?
THE DEVIL INSIDE
Imagine you were setting up a statutory insurer to fight against adult-onset diabetes. The insurer would collect premiums and pay for treatment after a person was diagnosed.
The big question is where the premiums would be levied. There is a key difference between this scenario and the workplace safety situation. Employers opt in to insuring employees when they hire them. Likewise, road users opt in to the TAC scheme when they register a vehicle.
The sort of population-wide coverage required by a diabetes insurance scheme means the beneficiaries could not be expected to cover their own premiums. (i.e. not without undermining the public nature of the health system! This fact may motivate some skepticism towards this idea from people who fear it is a Trojan horse for dismantling public healthcare. I don’t think it is.)
IT ALL COMES BACK TO CANBERRA
The only plausible premium-payer would be the federal government. That raises the question: How different, ultimately, would this be from Medicare? If the government is paying premiums into a public insurer and taking out the payouts to cover treatment costs, isn’t this just replicating an existing system?
The answer is it might be a replication. But if there is something in the culture, funding or control systems of the Health Department that makes it less than optimally effective, then there is a chance of improving outcomes by making a new organisational structure.
Following the Worksafe and TAC models, a good insurer would be focused on a single disease or group of diseases that we have at least some ideas how to prevent (lung cancers, diabetes, heart diseases). It would work on culture change and system changes to try to find the most cost-effective ways of reducing the incidence of that disease. (As an example of systemic changes, the organisation paying the premium might be more inclined to levy a sugar tax if it knew that would reduce its premiums for diabetes insurance). If it had success, the premium it would have to charge to the government for coverage would fall.
NDIS-ESQUE?
Any such systems would be different from the NDIS. The NDIS is far more about organising and coordinating the care for people who have disabilities. It is premised on helping people after the fact and is a vital service.
It does not seem, so far as my reading has shown, to have a focus on identifying avoidable disabilities and investing to avoid them. ( I am sure there are exceptions down in the details but at a high level NDIS is more about service-delivery than prevention.)
Sometimes puppers are not relevant to the post so much as reward for reading so far.
ISSUES
I’ve painted a picture above that I find promising, but I’m not going to expire in the proverbial drainage channel for this idea. I can see its weaknesses.
For starters, this looks like a case of bower-bird problem solving. You spot a shiny thing (TAC, Worksafe) and take it back to your nest. Then you’re seeking out a good way to use it. That is different to taking a first-principles approach to figuring out how best to optimise preventative spending. There may be better ways. And it could be that the azure sheen of TAC and Worksafe blinds one to the inherent unsuitability of the model in other environments.
Secondly, I may have mis-identified the effectiveness of those two organisations. I know their existence correlates with big improvements in the outcomes they’re targeting, and I know they are well-regarded but I can’t show causation. Other jurisdictions have similar organisations that are not as effective.
Third, the advantages might all fly out the window when you have the federal government paying the premiums rather than other customers. That’s a powerful customer and it might be hard to fight for justified premium hikes in tough fiscal situations, in which case the independence of the agencies becomes blurry.
Having said all that, I’d love to see a superlong .pdf getting into the guts of this idea and figuring out whether there is promise in it. If you work for a thinktank or a department and you’ve already written such a thing, please let me know!
Anyone else, please leave a comment sharing any insights or aspects you think are relevant!
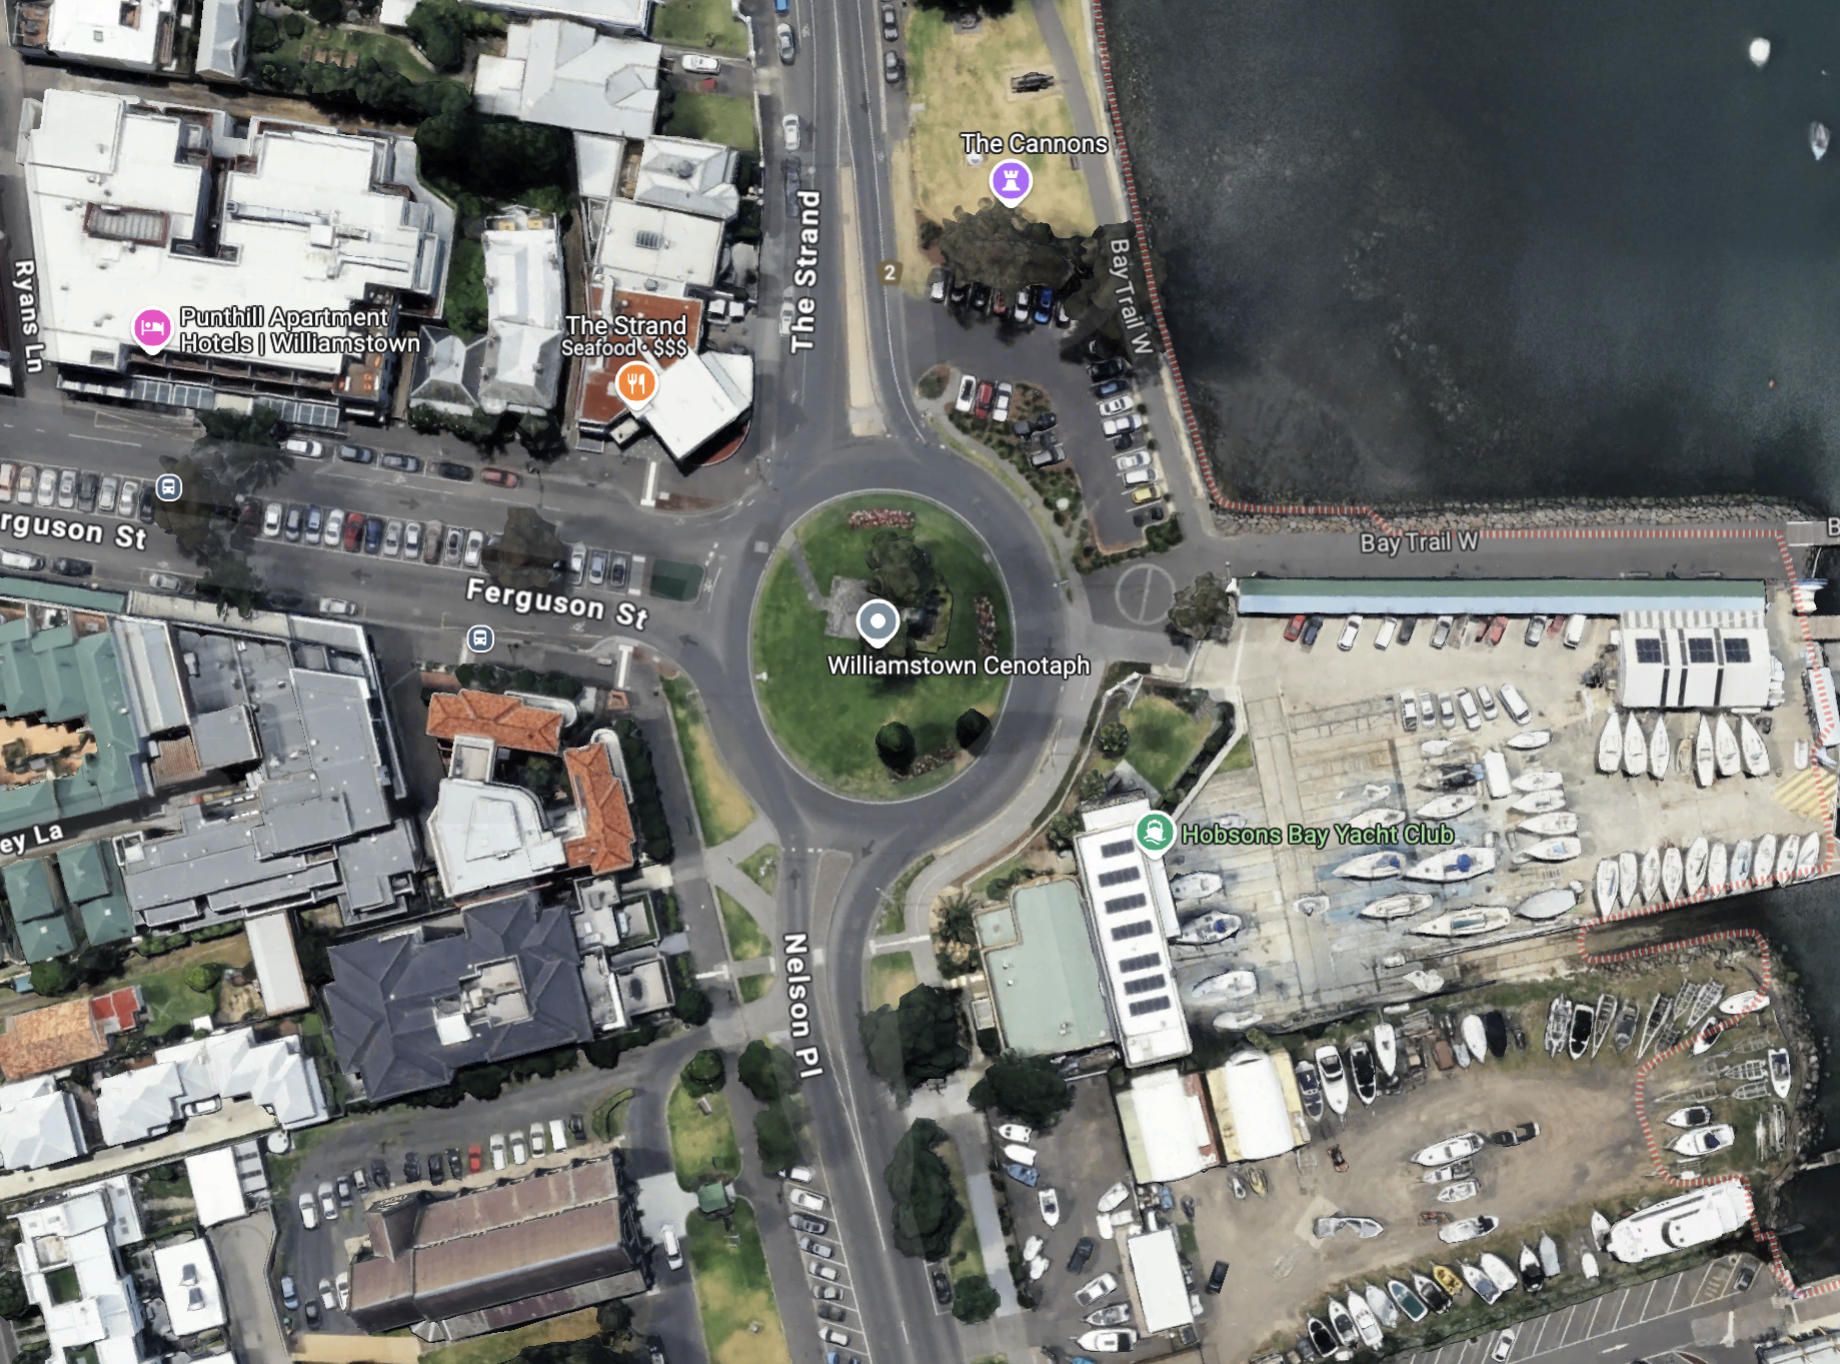
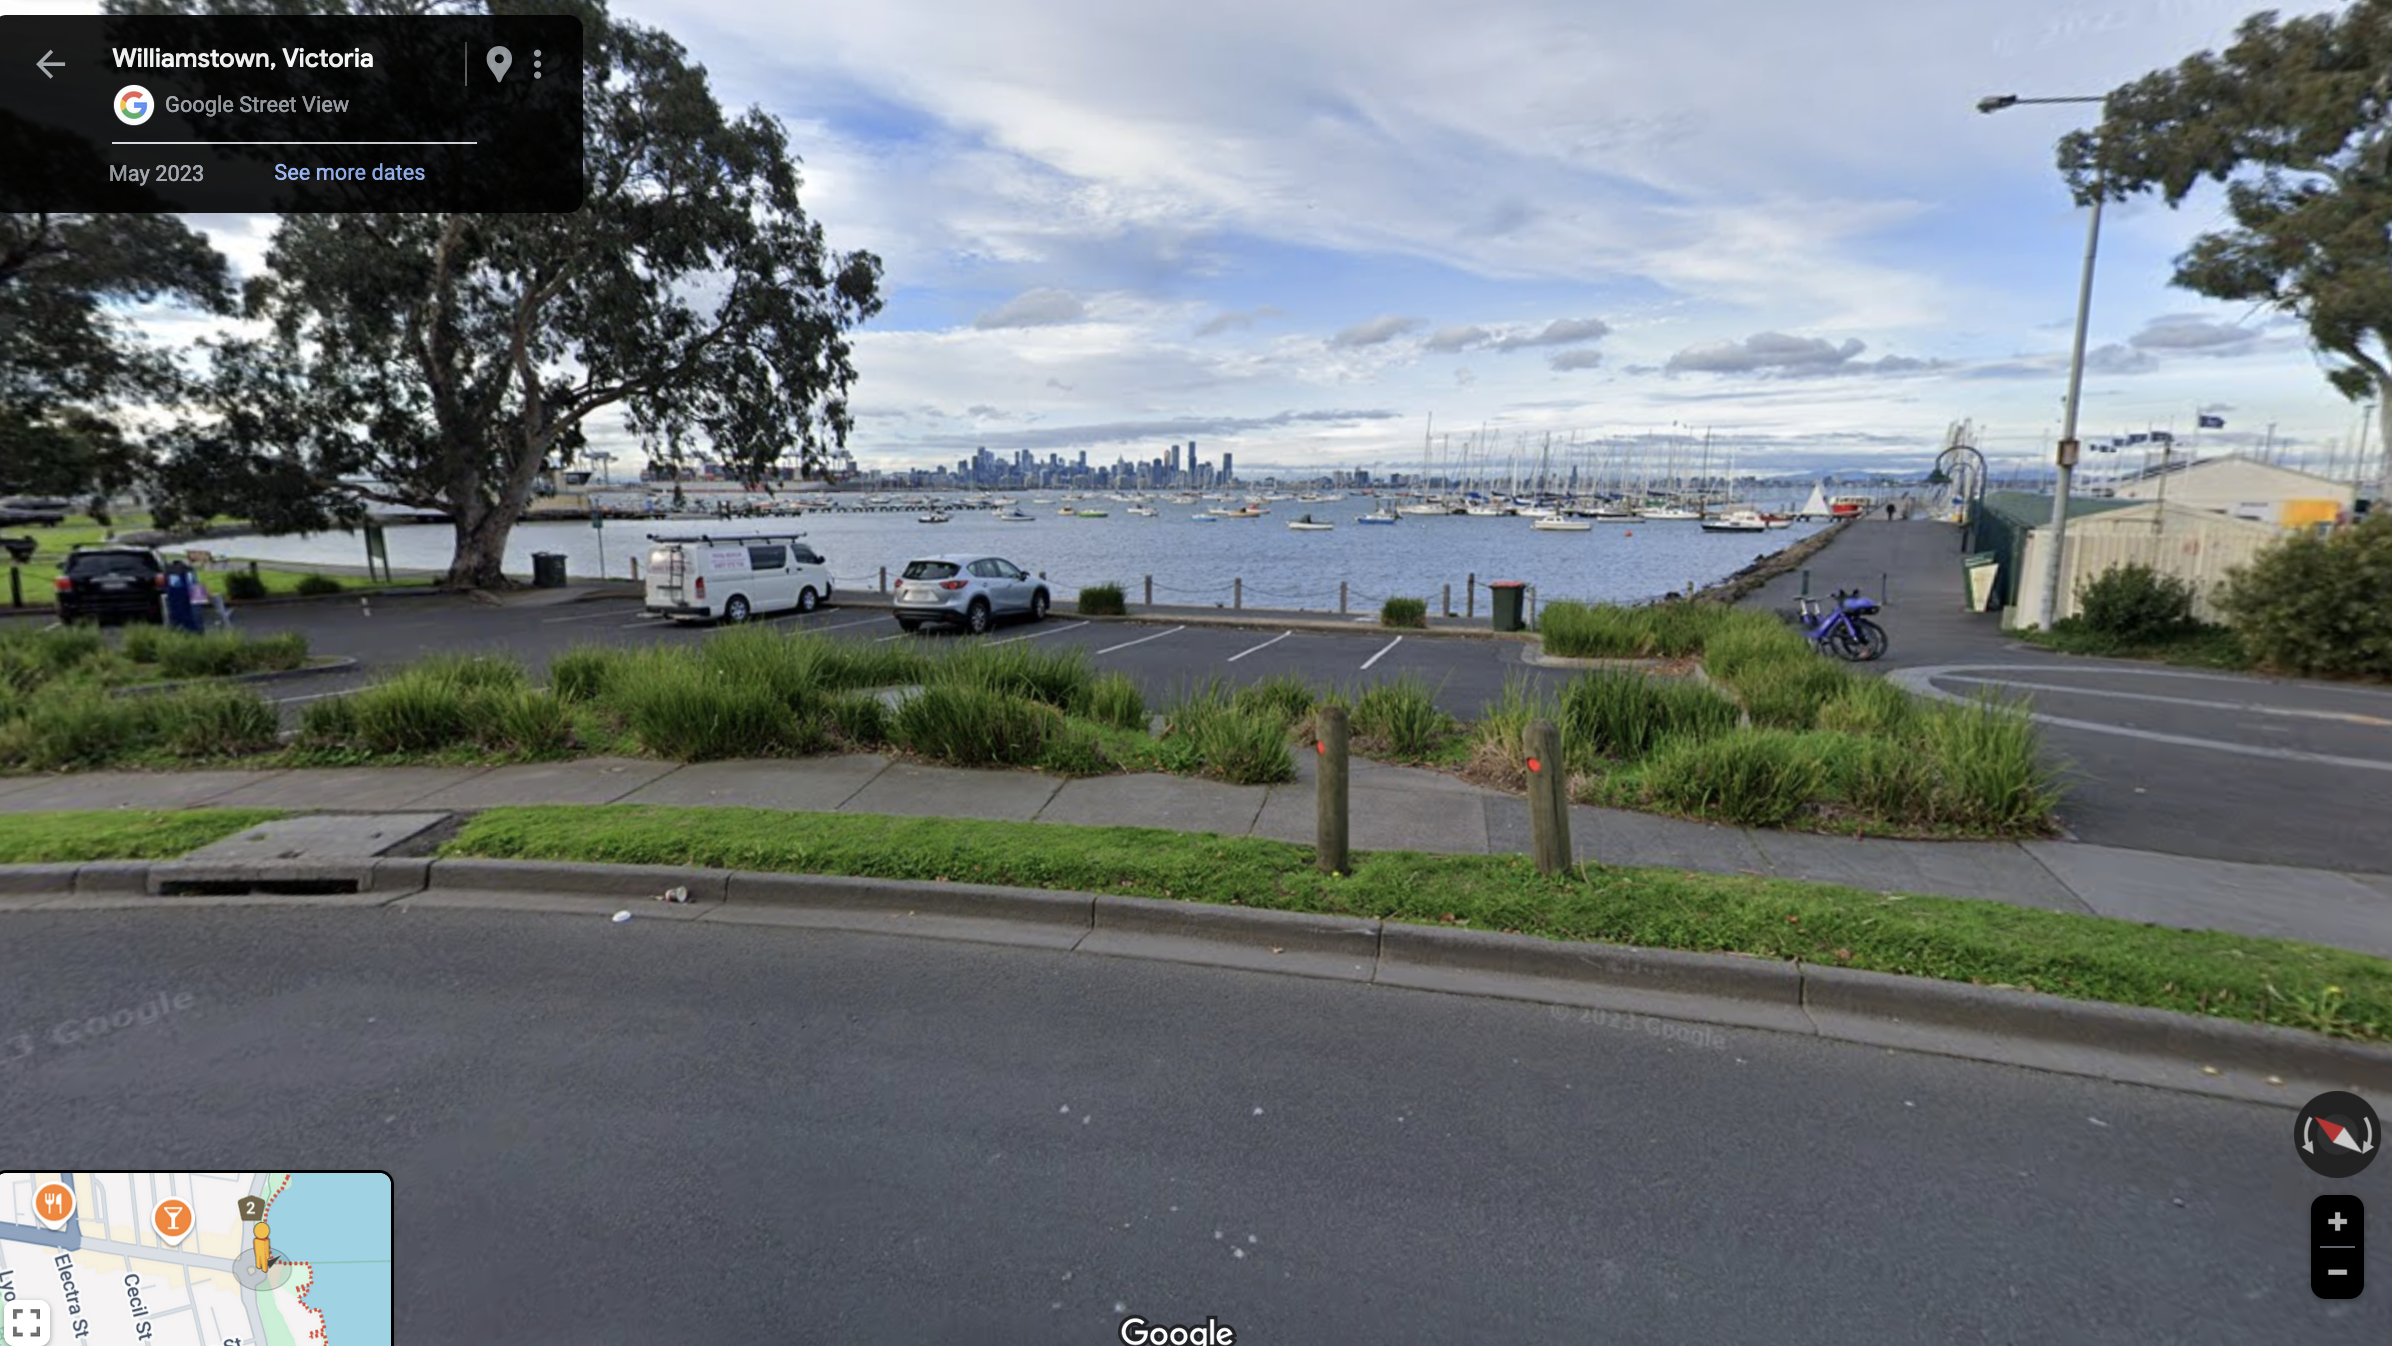
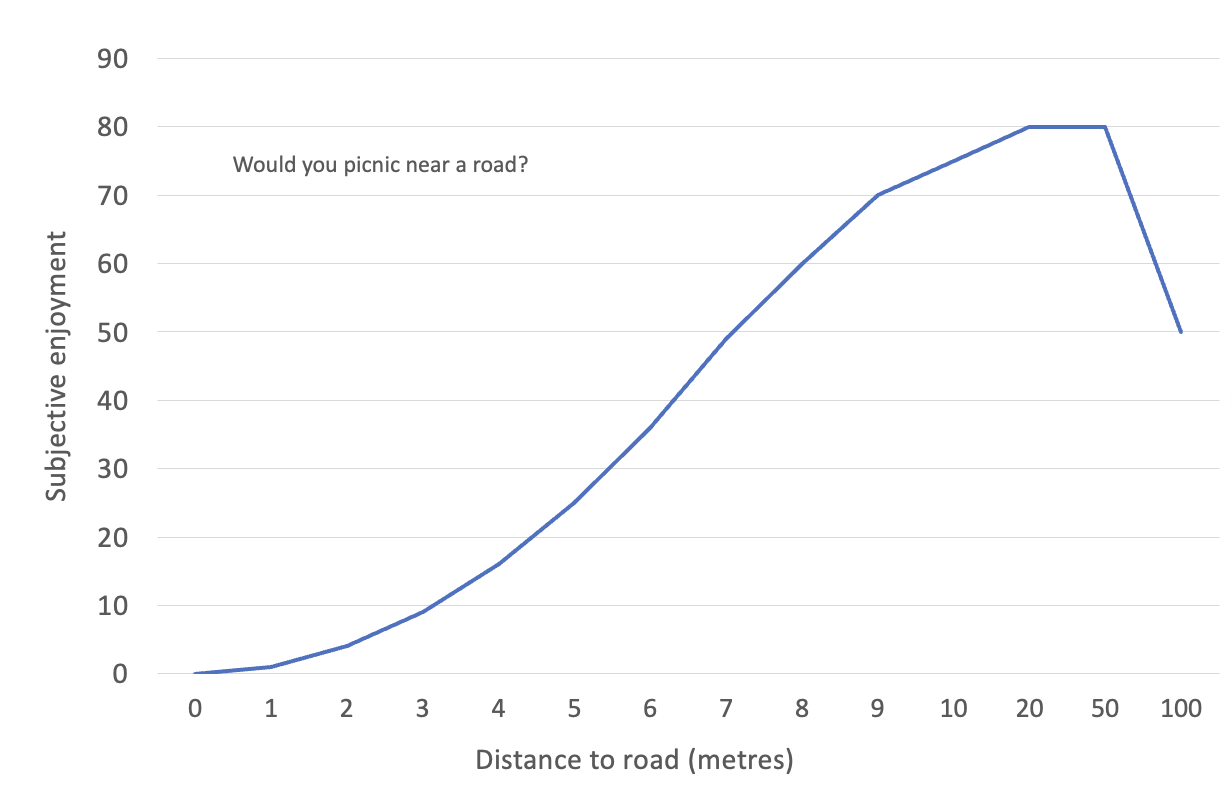

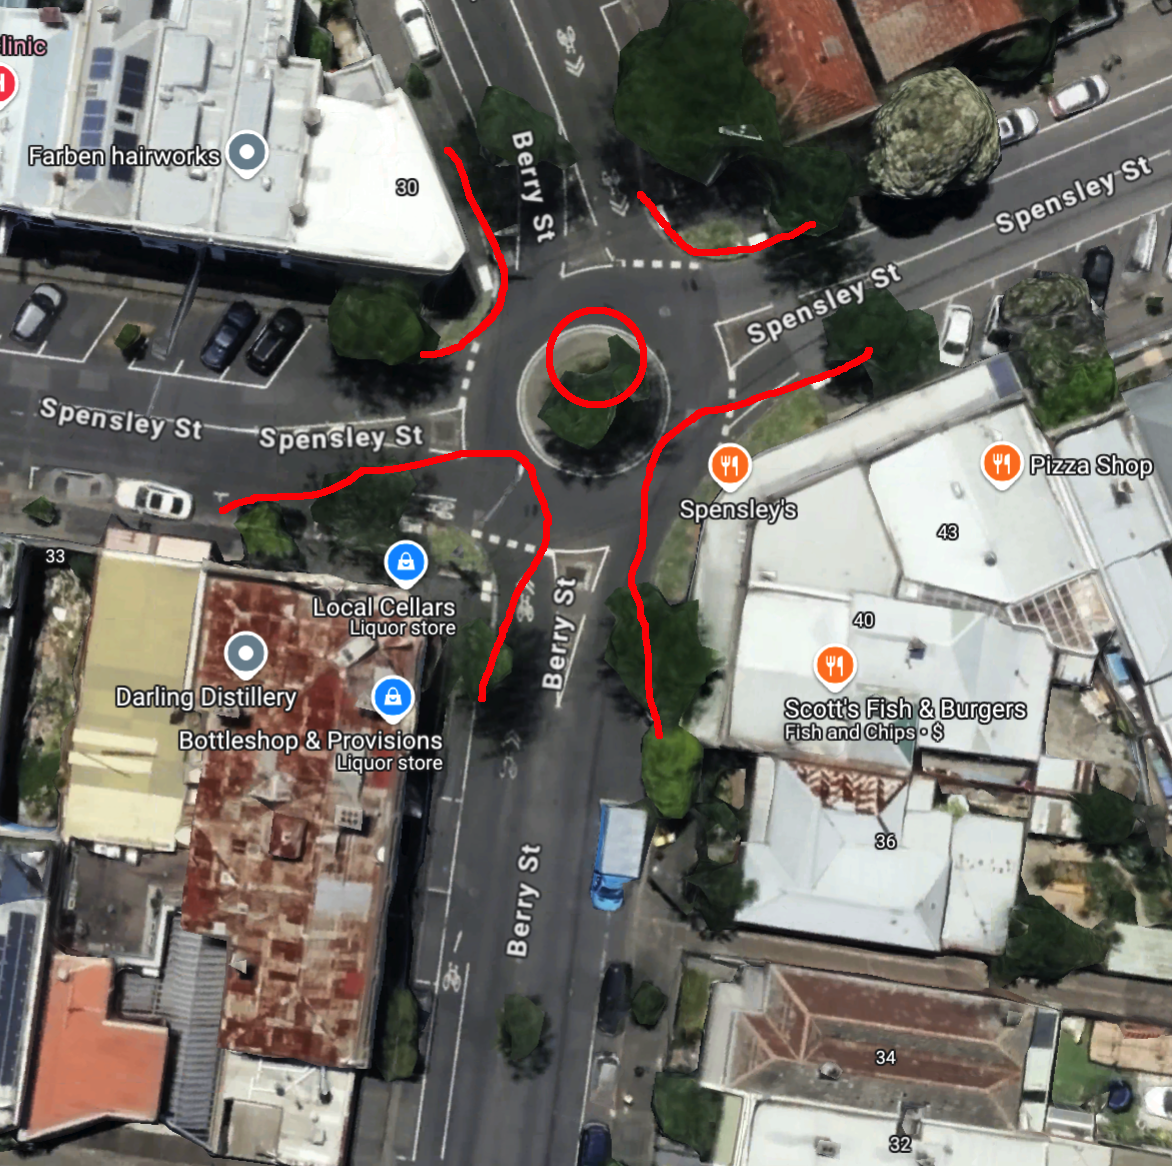


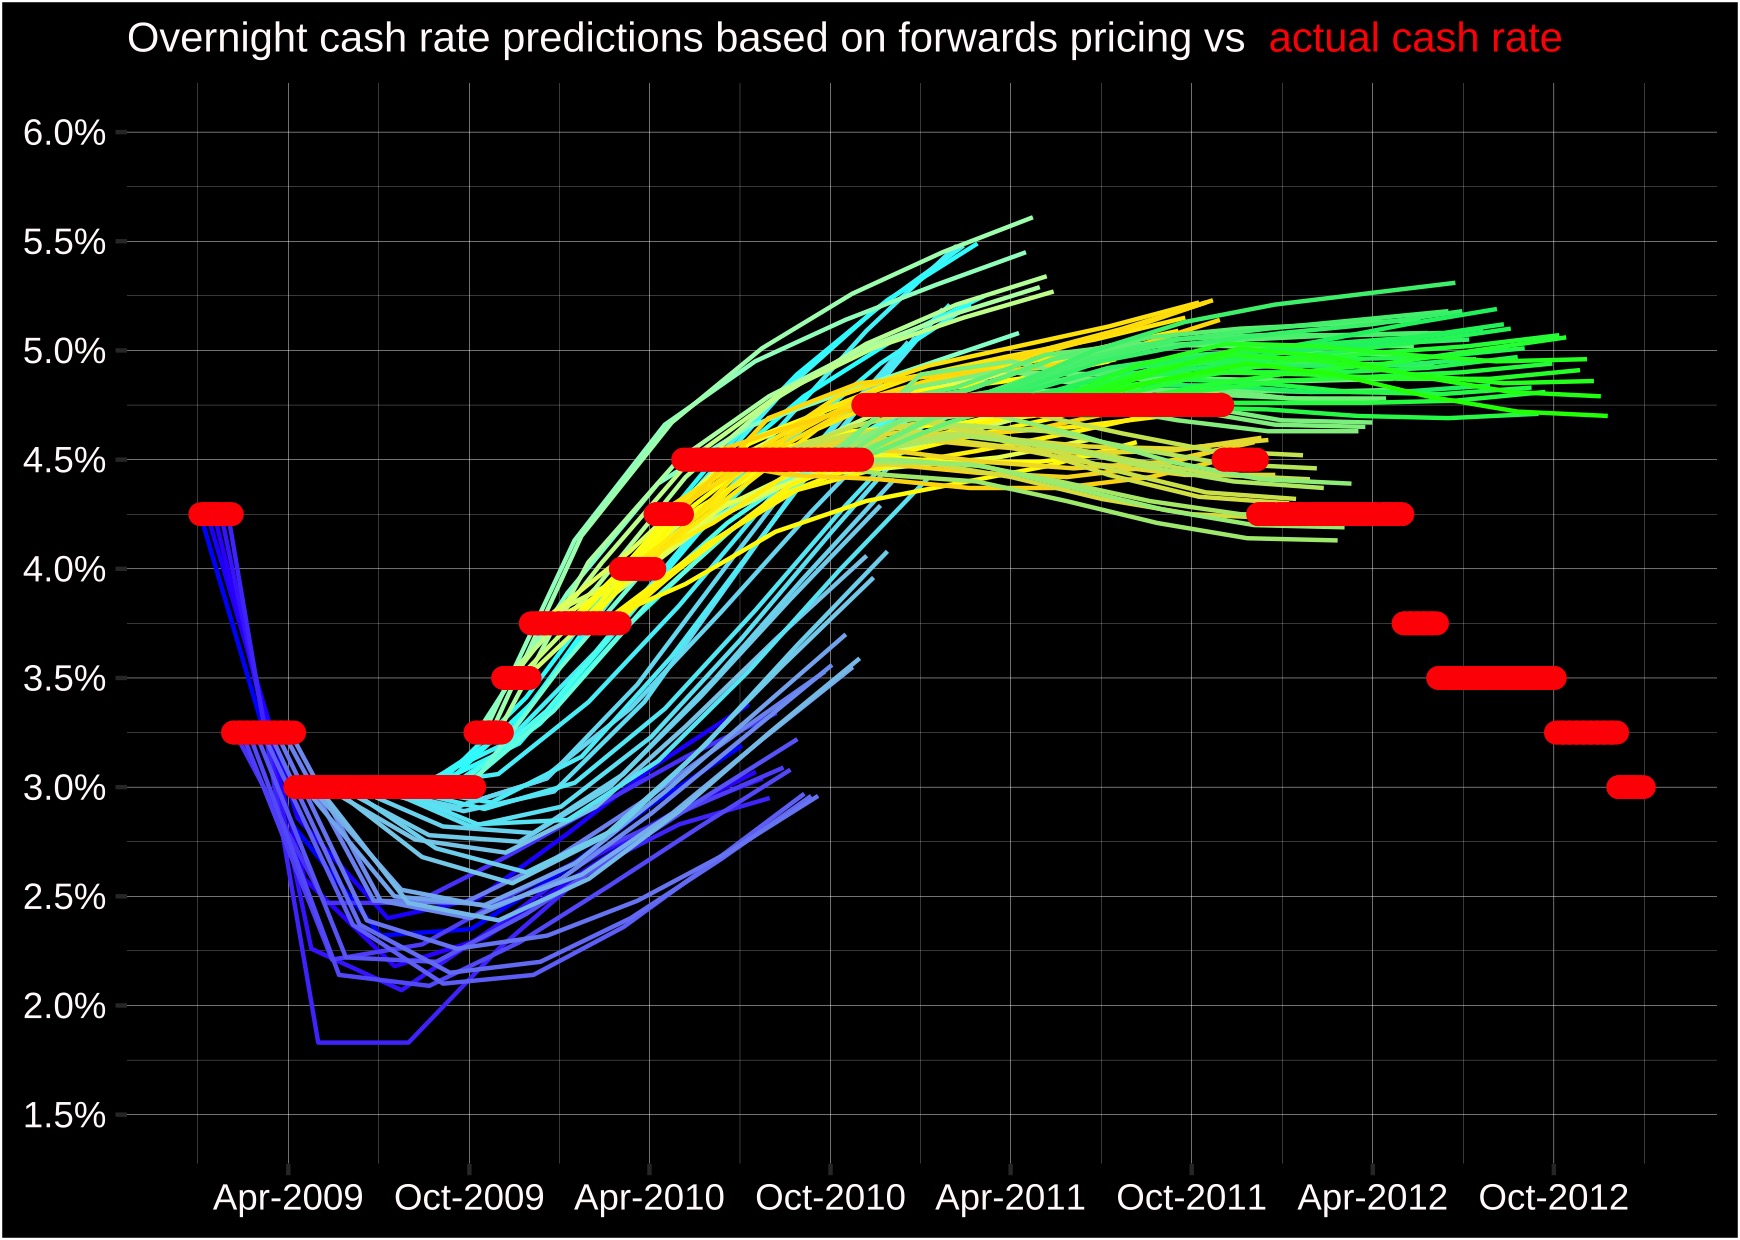
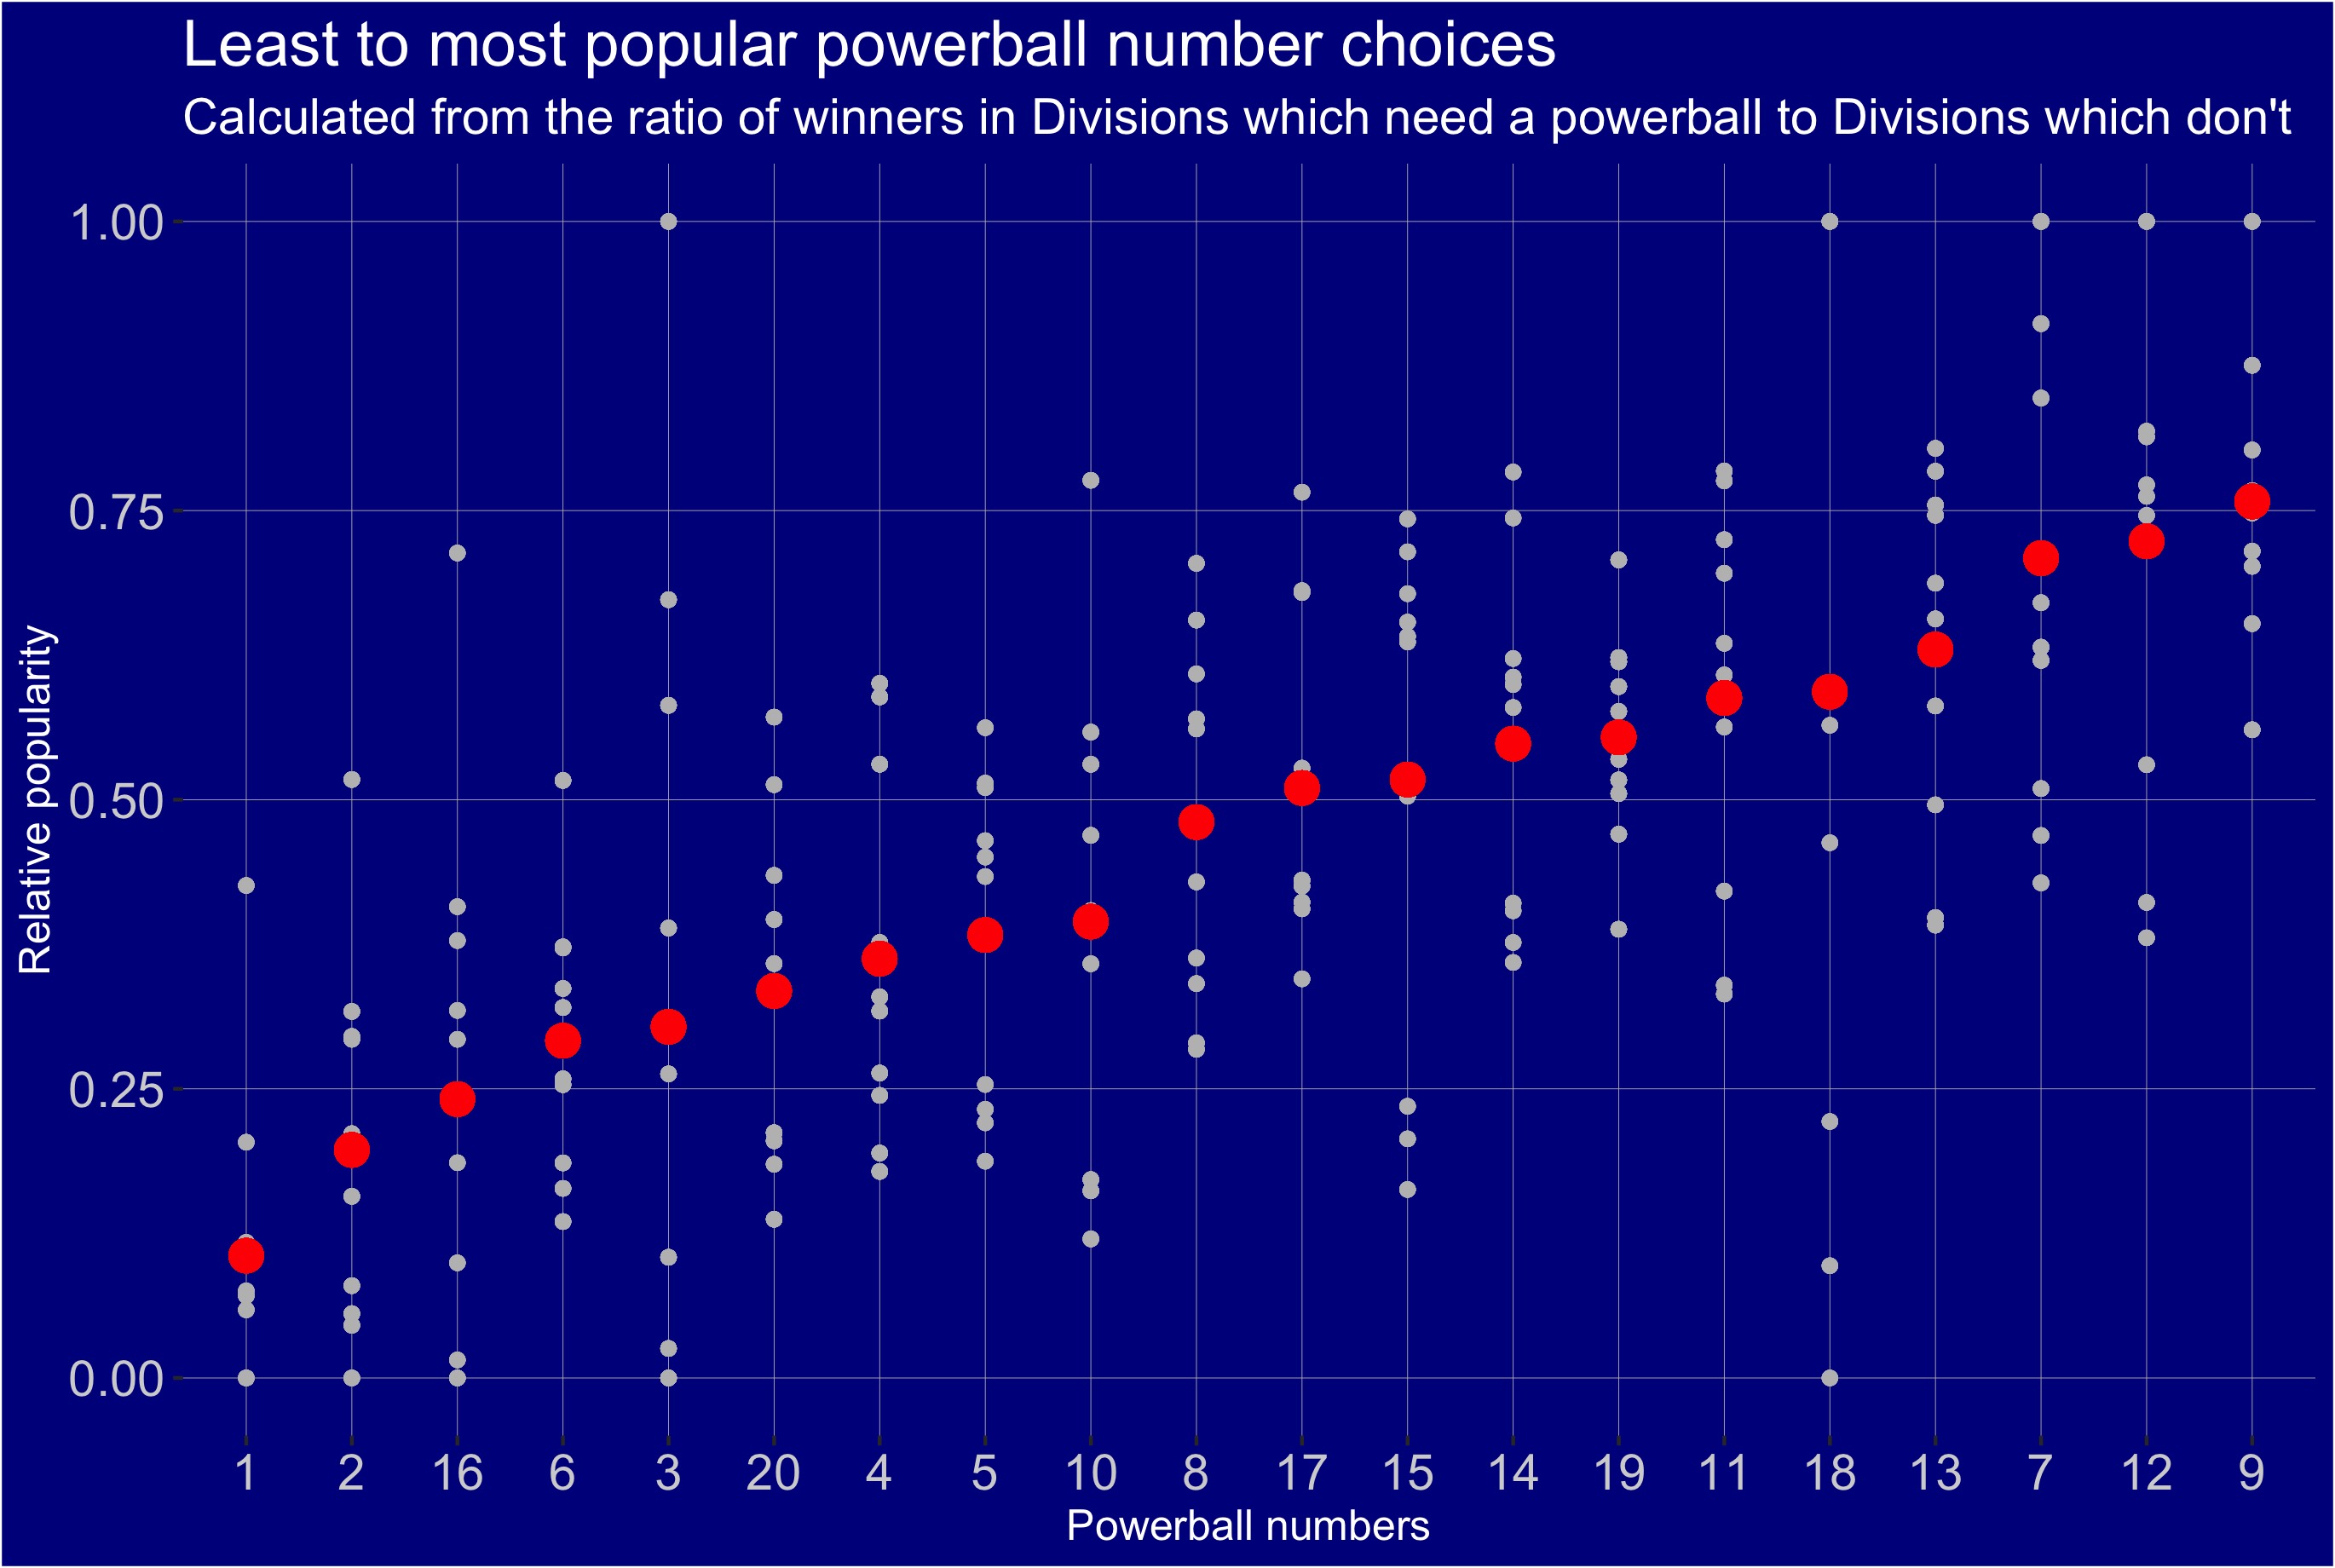


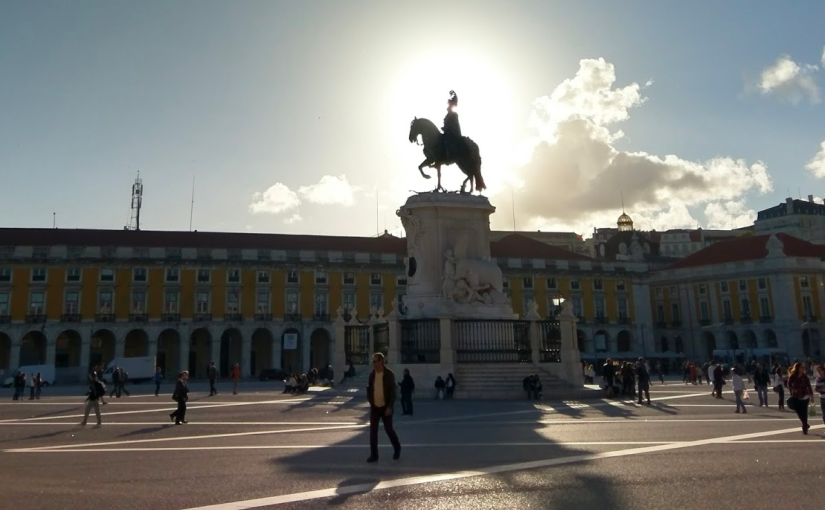


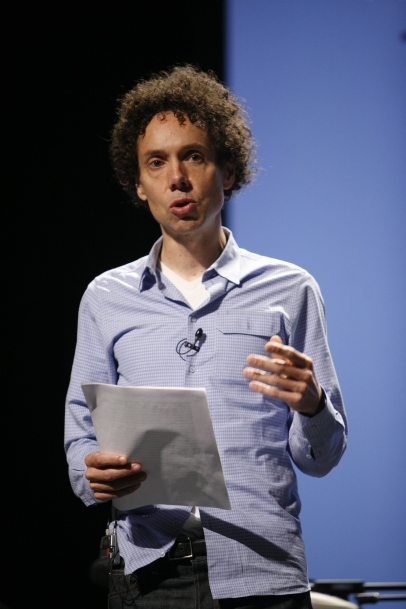


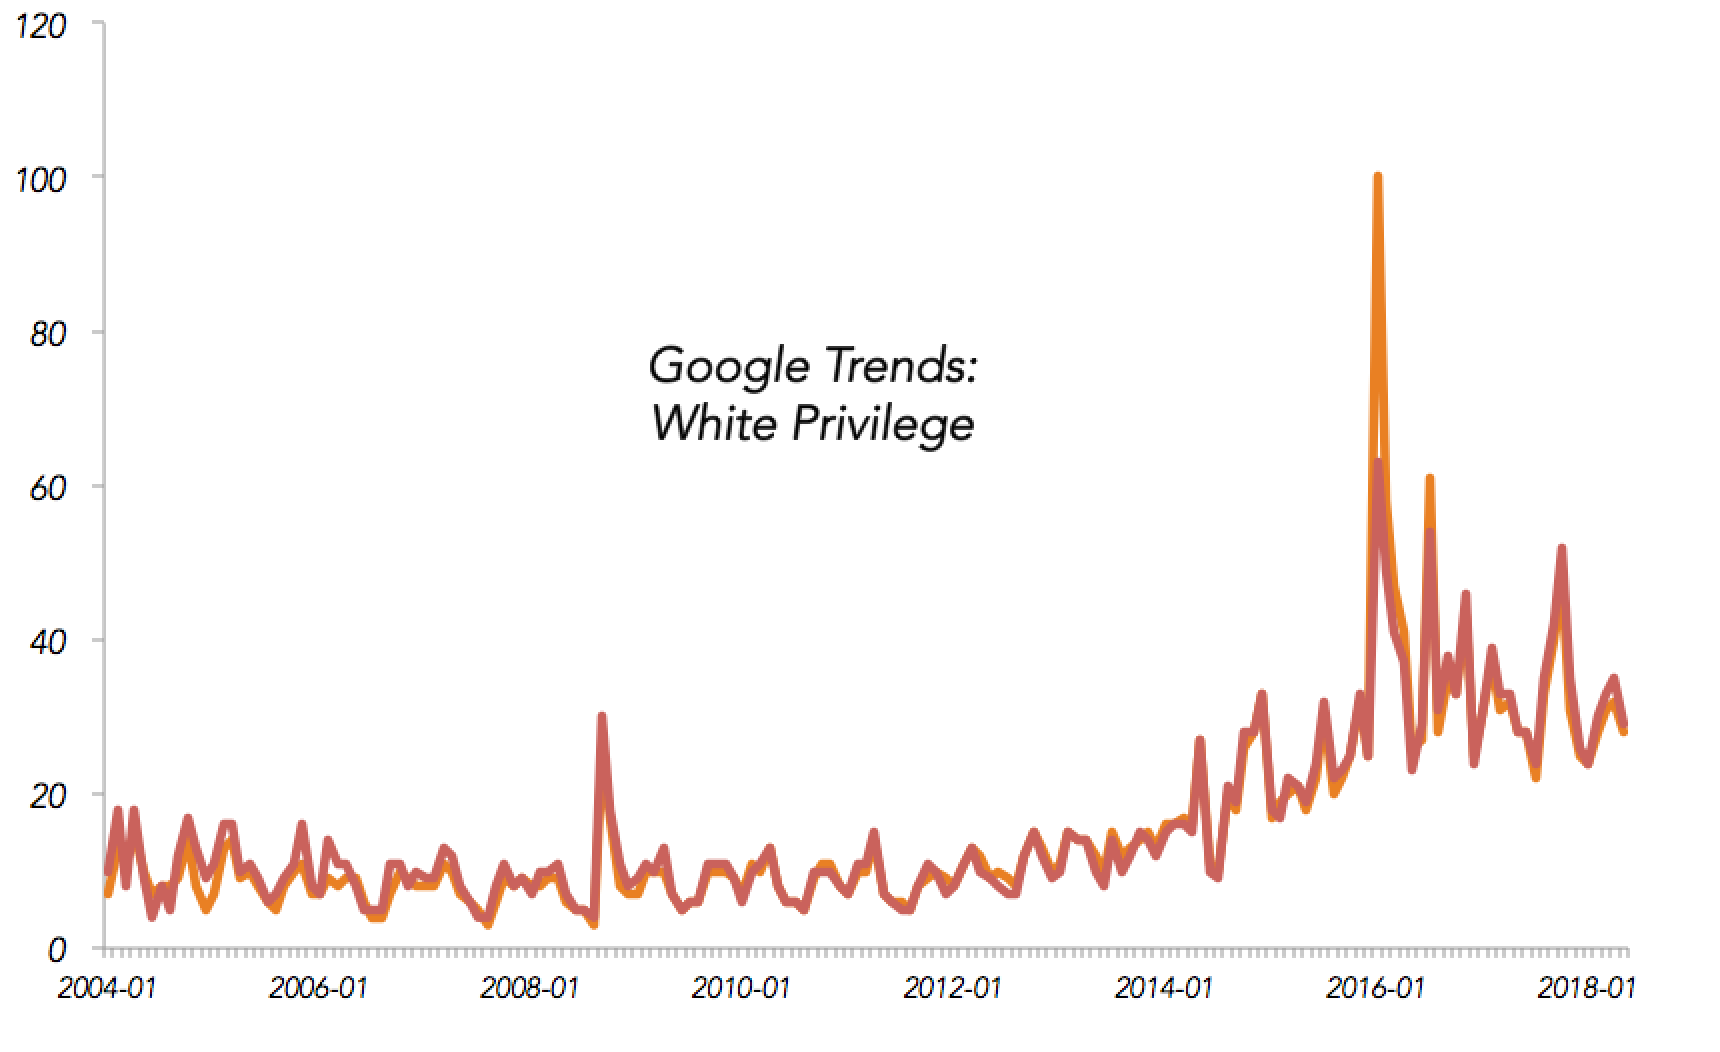
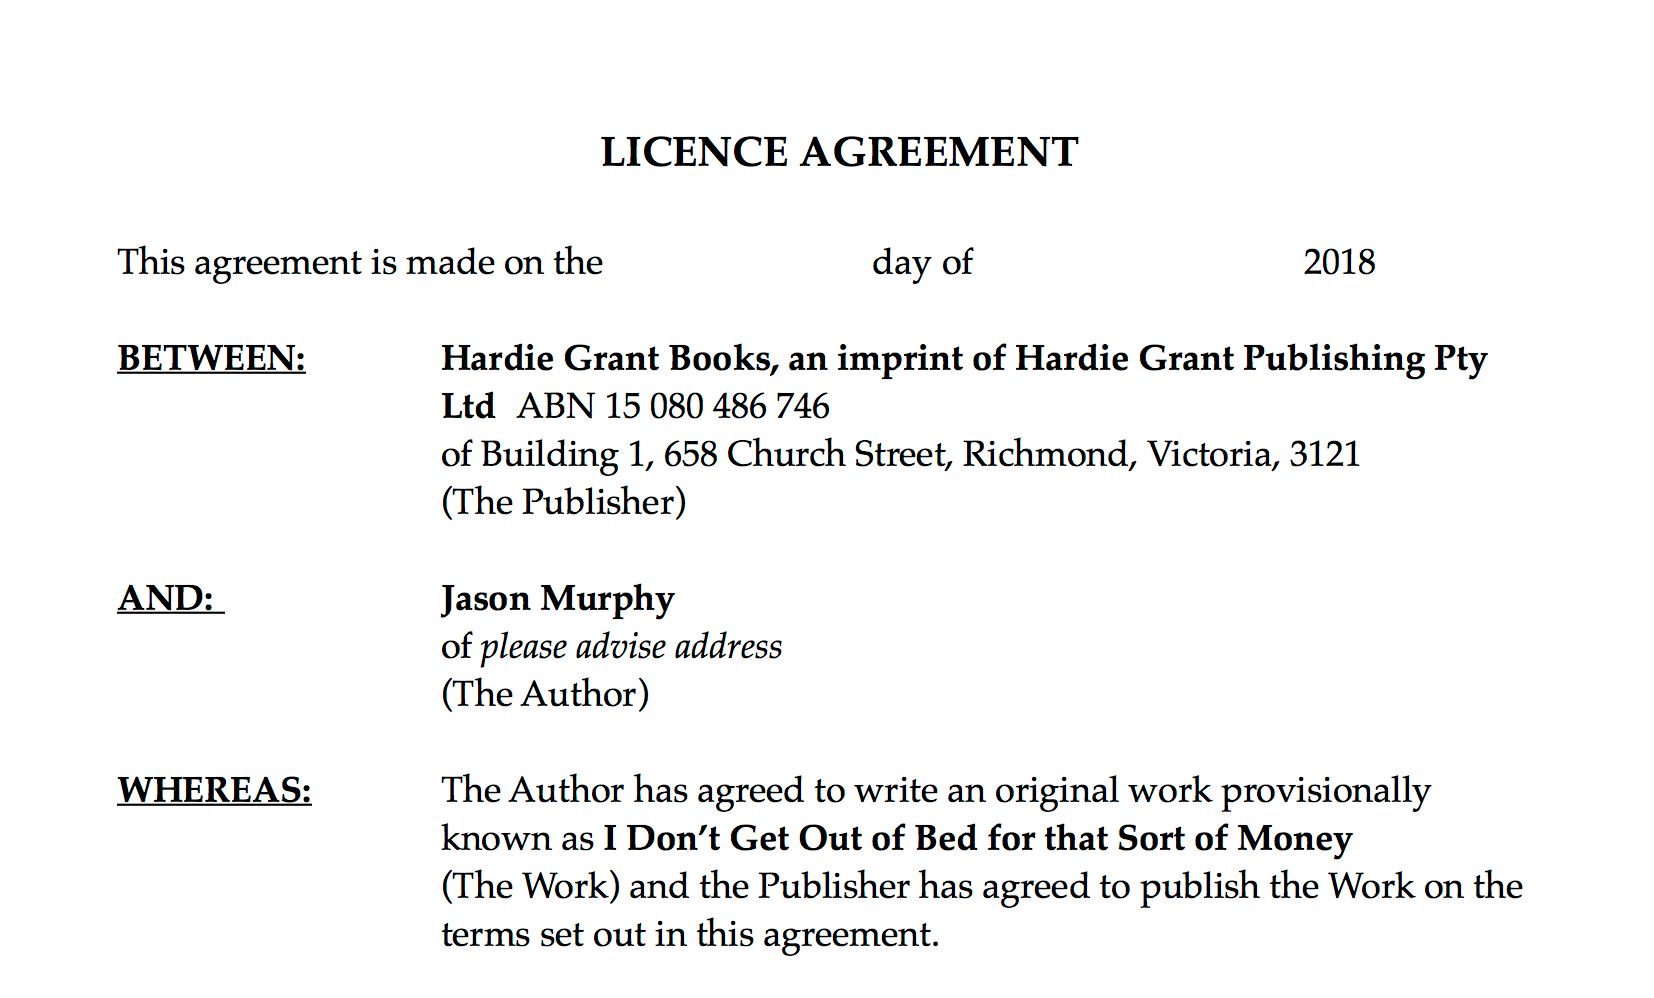

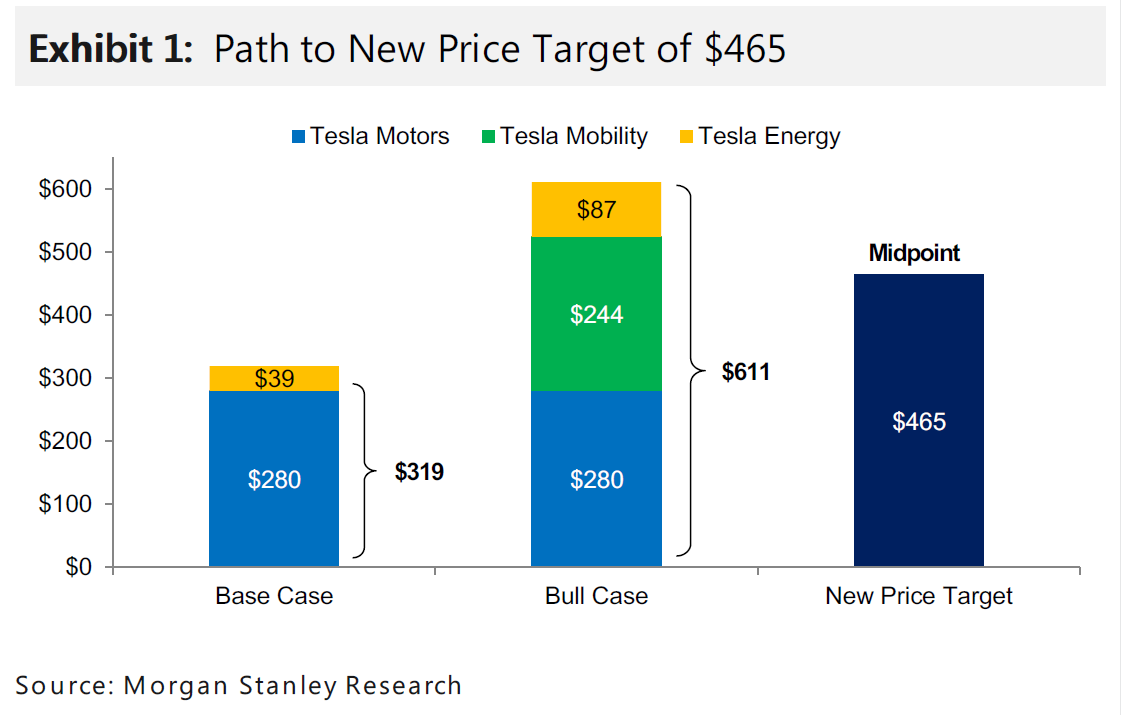


 Remember that despite the importance of CBDs, most jobs are still in the suburbs. If we know one thing about CBD jobs – especially nine to five CBD jobs – it is that they tend to be the good kind.
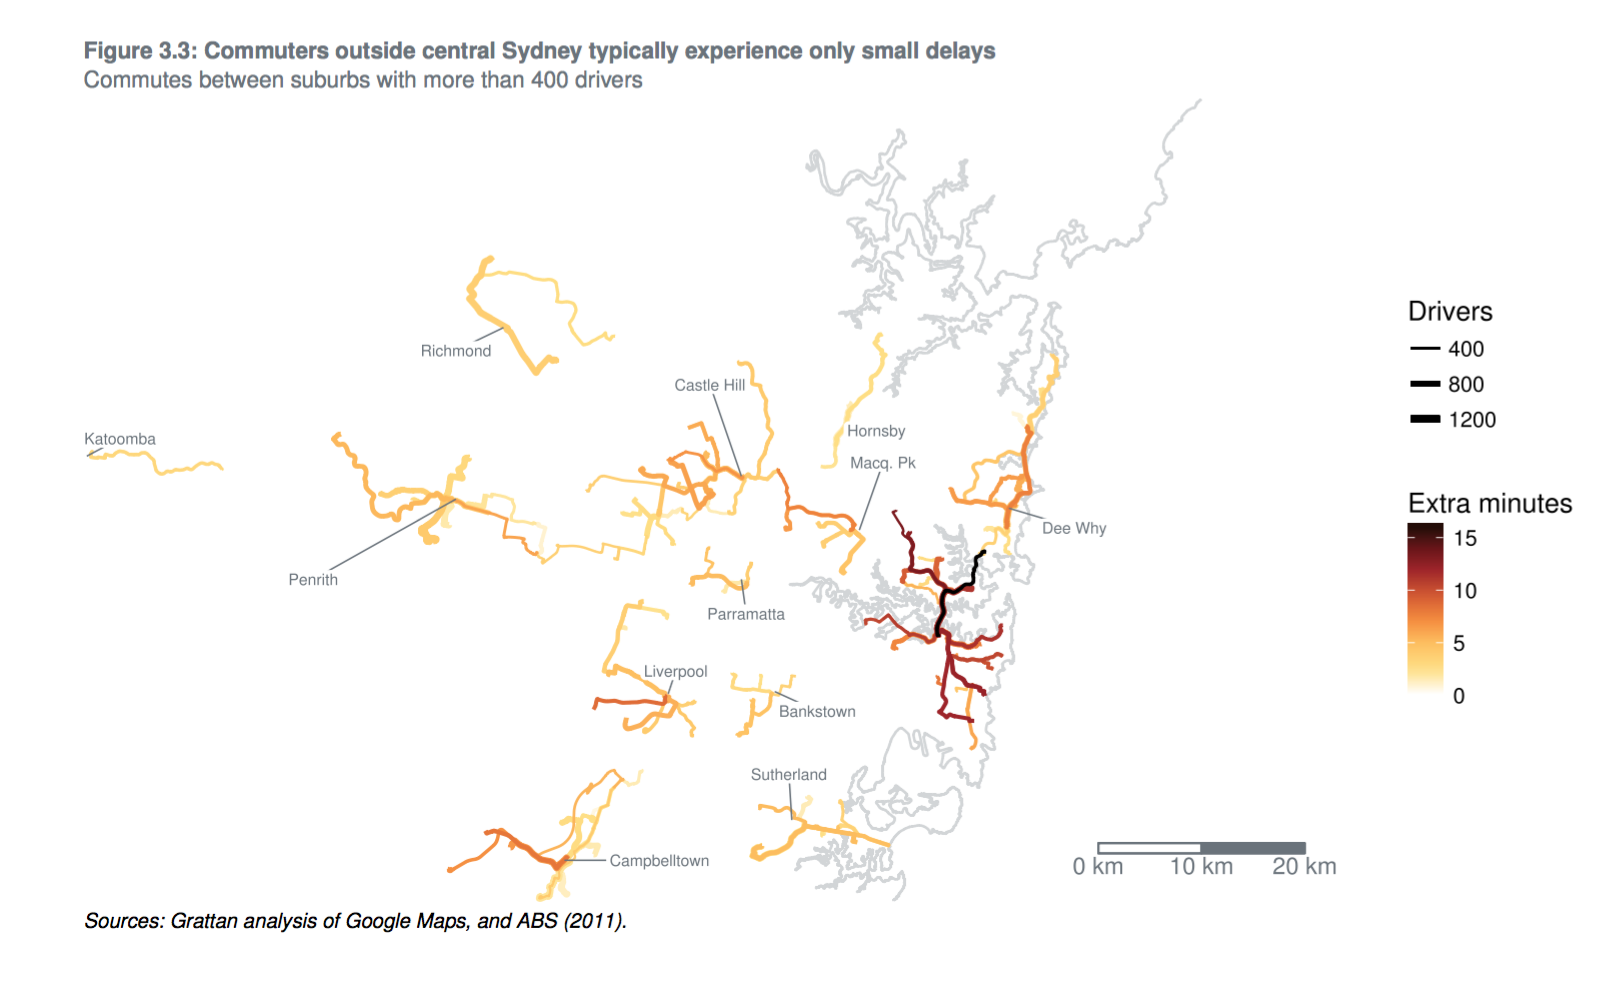


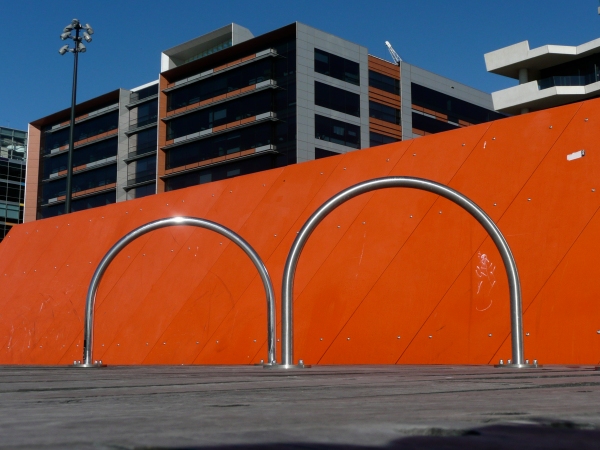
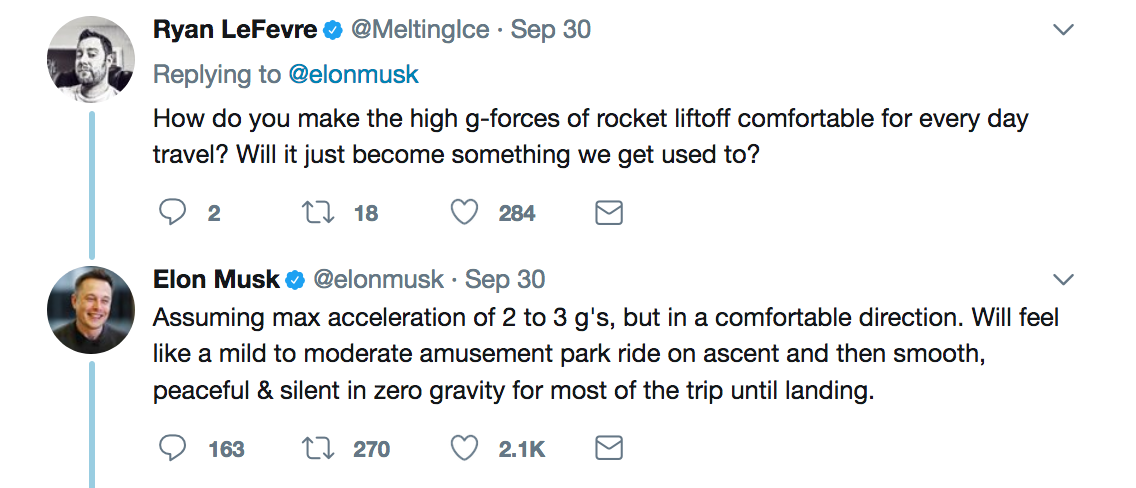

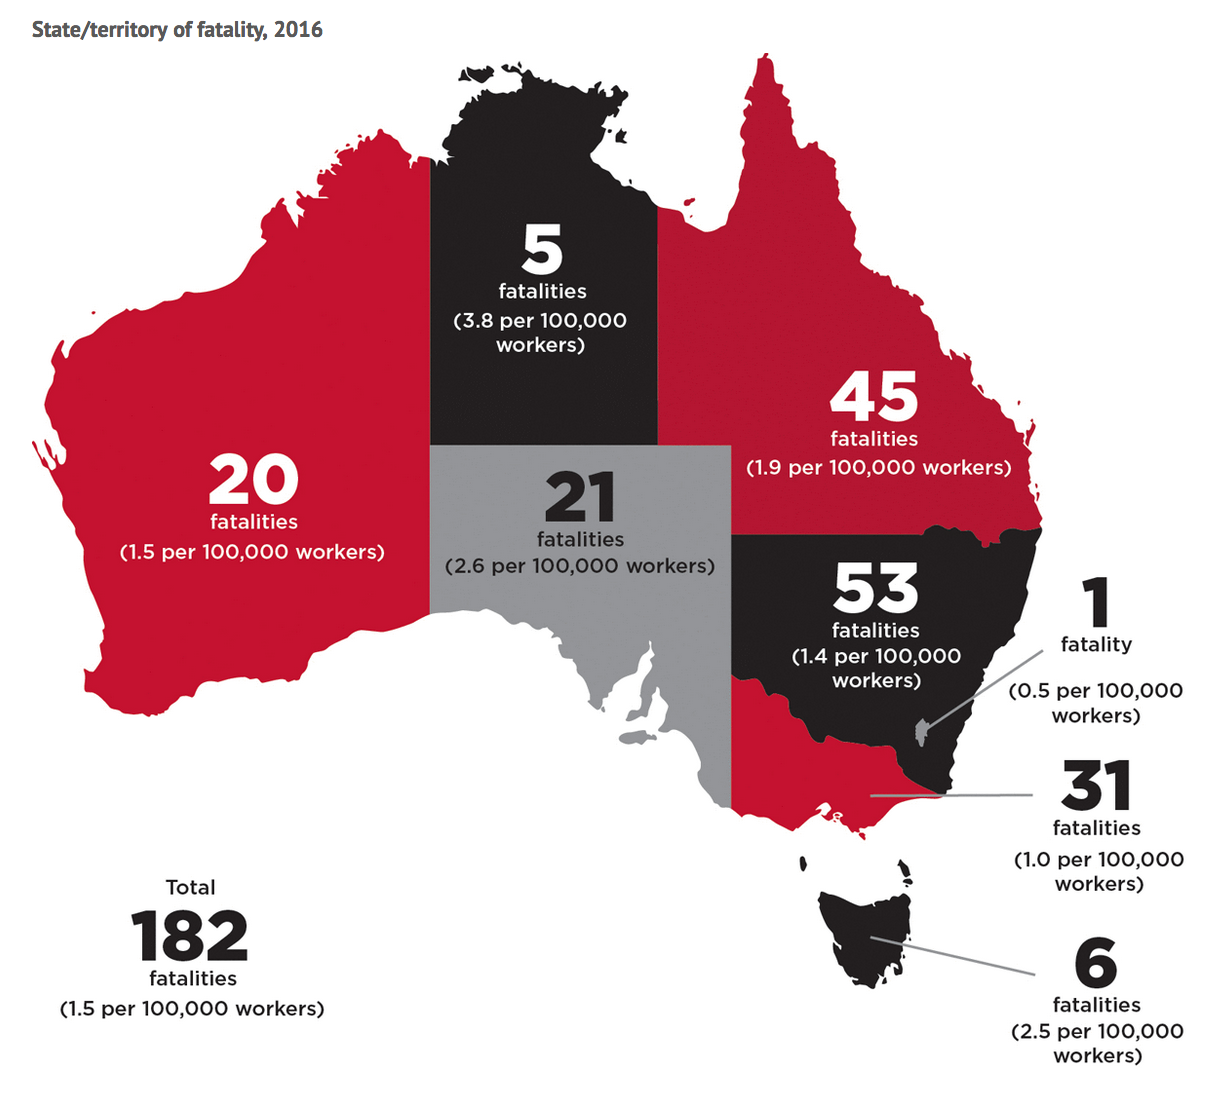 2.
2.