UPDATE DECEMBER 2016:
This post is miles off! It was all predicated on the numbers coming out of the ABS. What I didn’t realise was the extent to which they would be revised. Because sales of dwellings are reported late, the data get revised up. Generally 3 months afterward.
So. Here we are three months later and I can tell you the number of houses sold in the 3 months to June 2016 got revised up by 26 per cent. The scary looking charts below represent missing data. Sales have barely trended down at all.
I leave the post below for the sake of completeness.
–
When it comes to house prices, people usually just focus on the average price for sales in the last period. But a market is about more than just prices.
It is also about sales volume. And luckily, there is lots of detail in today’s official data on volume.
The market has suddenly turned skinny. Not so many homes are trading hands compared to recent history.
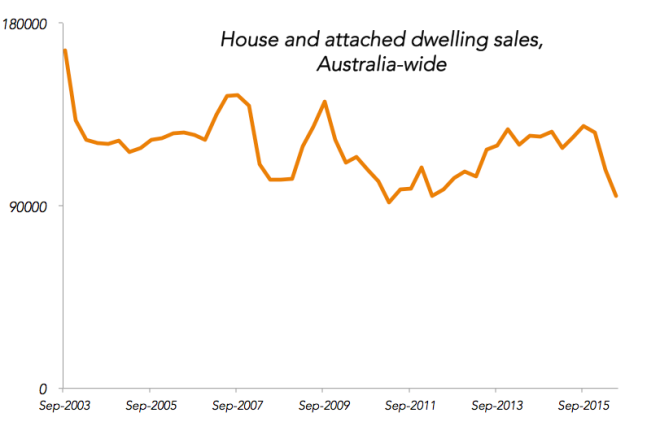
That is a pretty steep drop, and when you break down the data you find that it is mostly centred on detached houses (as opposed to attached dwellings, which include units, flats and terrace homes.)
The fall in sales is concentrated mostly in Melbourne and Sydney, but also Brisbane.

Now, there are reasons to not trust the newest, lowest datapoint. It will get revised upward as real estate agents hand in their data to the ABS. (Update in December: In retrospect this paragraph is the best part of the whole post.) Last year’s June quarter was revised up almost 50 per cent! If that happens again the results look less dramatic. But the fall is not all about the latest data point – it looks to have been going on since the start of the year.
If the apparent trend survives, this looks like a serious shift we should pay attention to.
The question is whether this information has any value. My quick analysis suggests it just might.
In previous times, plunges in the volume of houses sold have indicated the start of periods where prices faded away. The yellow periods in this graph go from the start of a fall in volumes traded to the end of the slide in median house price. You can see a house trading volume fall can mark a period of house price stagnation.

For another look at those yellow periods, here’s the RBA’s housing prices graph. 2008 was a shorter sharper dip and mid 2011 was a longer one.

Might we be about to see the lines head back below zero? And if so, how far below zero will they go?

Hello! Those graphs are interesting indeed. What are your thoughts on what occurred in maybe 2004, where the number of homes traded dipped dramatically, but the median house price continued to increase? Interested in hearing your opinion! :)
LikeLiked by 1 person
Good question. If you squint maybe the price line flattens a bit after the 2004 sales peak? But it would be best to say the number of houses sold dropped quite a bit betweeen 2002 and 2008 while prices rose.
And also I suppose I should note the even longer trend of house sales volumes falling while prices rise, across the series as a whole.
Complications like that are why, even though I suspect houses are overvalued and their prices could fall, I wouldn’t bet my life on it happening!
LikeLike
The Chinese won’t be coming to save us for two reasons. Firstly the Chinese government has brought in extremely strict currency controls as part of an anti-corruptions crackdown. Secondly the FIRB doesn’t allow existing properties to be purchased. Failed settlements are regarded as an existing property under FIRB rules
LikeLike
” Firstly the Chinese government has brought in extremely strict currency controls as part of an anti-corruptions crackdown. ”
Yes indeed, in theory. But cracks in their wall are large enough to drive a train through. So forget about ‘official’ controls.
As for the FIRB and their role in this. A hopeless lot, if ever. Controls, forget about them. Perhaps read up on the trials of “Chodley Wontok”
About the only thing that would temper Australian housing prices would be for us to adopt the Vancouver fix …
LikeLike
So what does this mean for first home buyers in Melbourne/Sydney? Doomed for eternity?
You should do a piece on that. Surely interest rate sensitivity is a MASSIVE issue – a small increase in rates is going to put the wind up a lot of people who are on the edge as is.
There are a lot of people out there with an adequate deposit who cant afford the repayments so are staying away….
LikeLike
Who’s on the edge most FHO’s service just fine and are assessed to do so at 7.5%.
The 1989 Sydney median was $171k and Interest Rates were 18%, repayments =$31k pa. Adjusted for inflation is $64k pa in today’s dollars.
2016 Sydney median $1.2m and Interest Rates are 4%. Repayments= $48k pa.
FHO’s have it easier today, it’s only the deposit they struggle with.
LikeLiked by 1 person
Hi Thomas, just came across this blog. In New Zealand we have a pretty clear supply shortfall, induced mainly by restrictive planning, council infrastructure rationing and land use rules. We are also seeing a huge shortfall in listings of houses for sale. My theory is that low interest rates are causing investment property owners to hang on to their now higher yielding investments, which leads to lower stock for sale.
Your post seems to suggest that current booming prices are causing people to defer sales in the expectation of higher future prices?
LikeLiked by 2 people
I’m trying to be careful not to ascribe motivations to the market! Who knows if this apparent shortfall, (if it is not erased by revisions to the data) is because of reluctance on the supply side or buy side.
But from the sharemarket you can see that price volatility is higher on days when volumes traded are lower.
It makes me wonder whether there is extra vulnerability in the market to a spike in supply.
Alternatively, so much pent up demand from all te deferred purchases could have a smoothing effect on the next decade or so of house price volatility as people who are renting homes longer than they expected buy the dips!
LikeLike
Enjoy your articles Jason: you communicate economics well! As to foreign propery buyers, a big unknown is all the sabre rattling around the world getting out of hand!
LikeLike